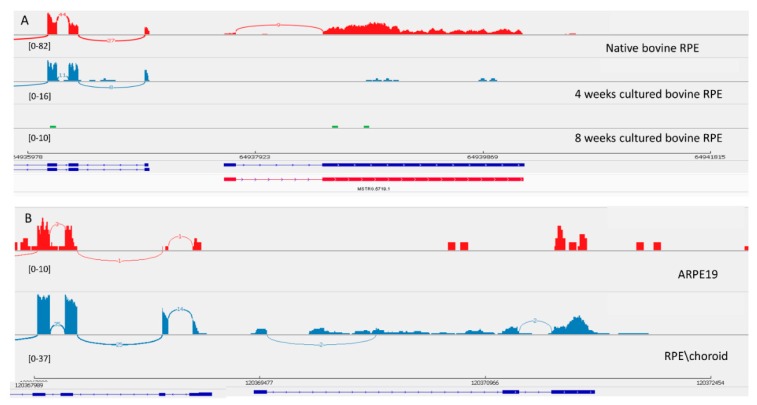
Figure 4.
View of MSTRG.5719 from the Integrated Genome Viewer (IGV). IGV–Sashimi plots showing the read coverage and transcript isoforms. The histograms represent the sum of the aligned sequencing reads along the genome. Numbers in square brackets indicate coverage range. Junction reads are plotted as arcs, and the number of reads aligned to the junction spanning the exons connected by the arc is indicated. (A) Sashimi plots from bovine genome; red histogram represents the coverage for native bovine RPE, blue is 4-week cultured bovine RPE, and green is 8 weeks cultured bovine RPE. Below the histograms are shown the predicted isoforms (blue), experimentally verified in this study (red). (B) Sashimi plots from human genome; red histogram represents coverage for ARPE-19 cells and blue represents the native human RPE/choroid. Below the histograms are shown the Ensembl genome browser isoform (blue).

