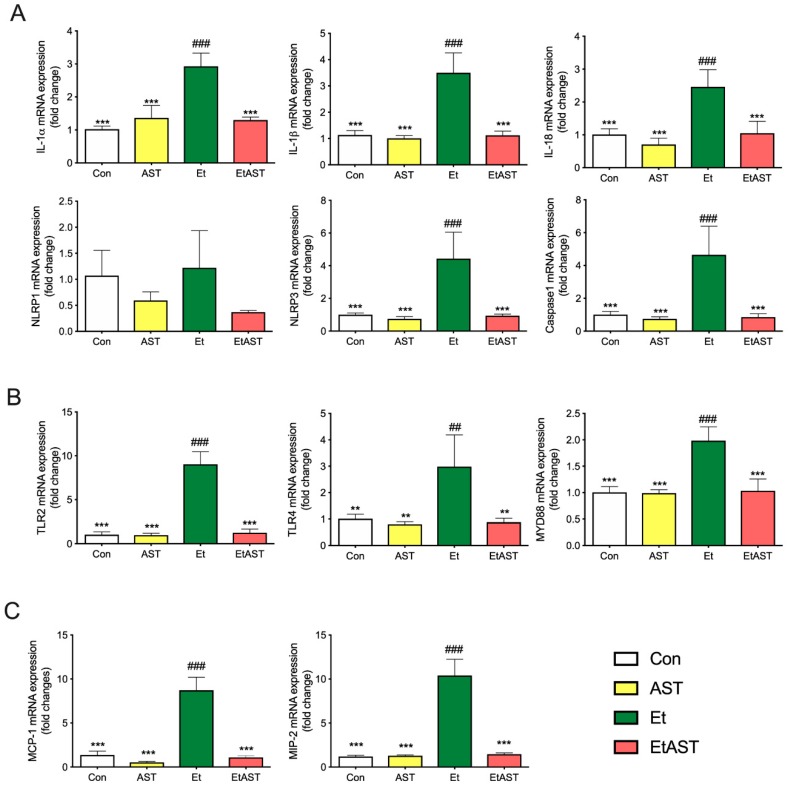
Figure 3.
Hepatic mRNA expression levels of associated genes in (A) the NOD-like pathway, (B) Toll-like pathway, and (C) chemokines pathway in the Con, AST, Et, and EtAST groups. Relative mRNA expression levels were determined by real-time RT-PCR and normalized to 18s rRNA as an internal control. Data was represented as means ± SEM (n = 6; ** p < 0.01 versus Et; *** p < 0.001 versus Et; ## p < 0.01 versus Con; and ### p < 0.001 versus Con).

