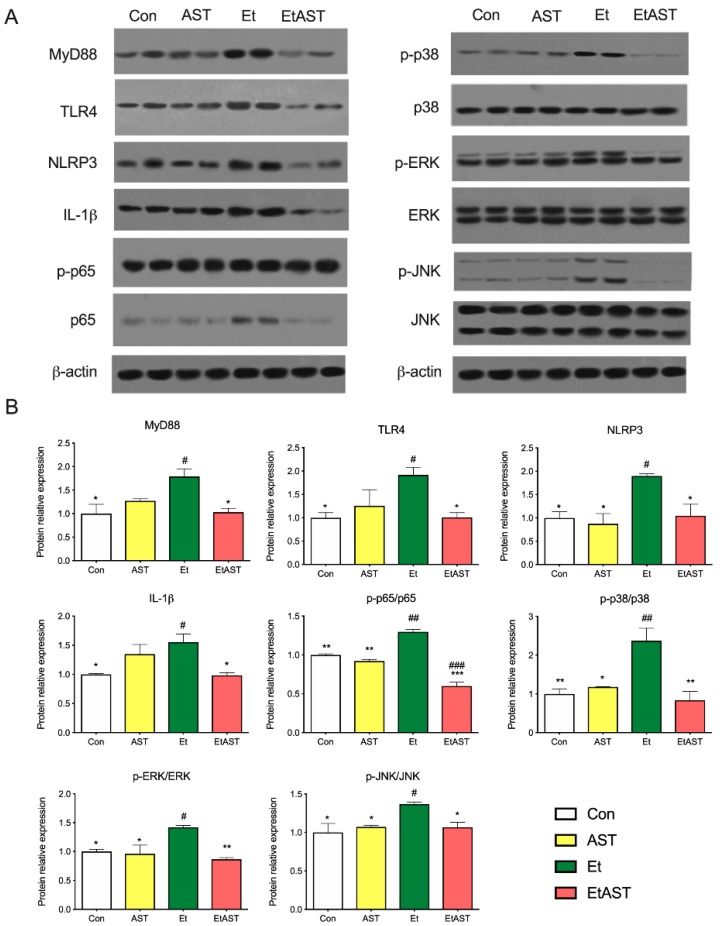
Figure 4.
Hepatic protein expression levels of selected genes involved in the NOD-like pathway, Toll-like pathway, and chemokine pathway. The protein expression (A) and relative protein levels (B) were measured by western blot analysis. The relative protein levels were measured by Western blot analysis. Data was represented as means ± SD (n = 6). * p < 0.05 versus Et; ** p < 0.01 versus Et; # p < 0.05 versus Con; ## p < 0.01 versus Con; and ### p < 0.001 versus Con.

