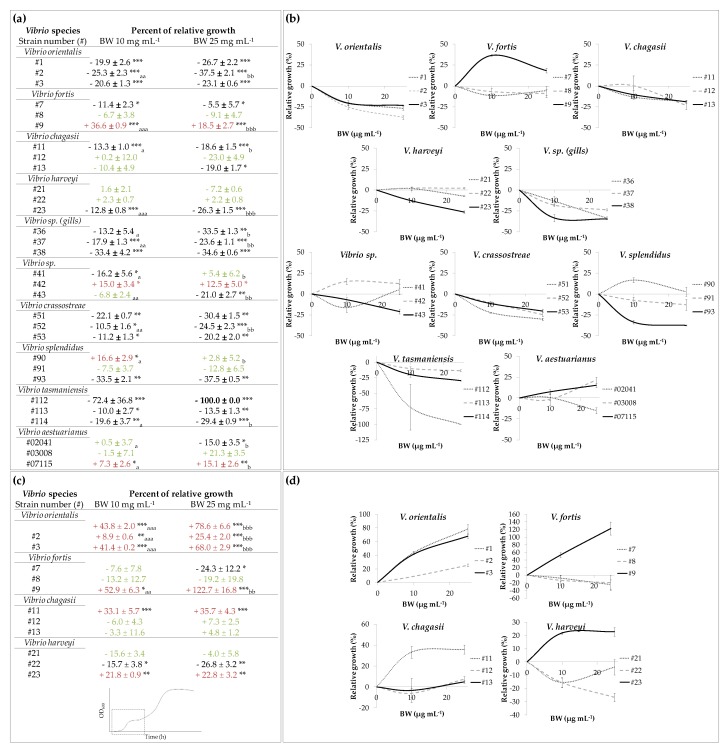
Figure 2.
Screening experiment. (a) Relative maximum population size (%) of Vibrio strains exposed over a 24 h period to concentrations of 10 µg mL−1 and 25 µg mL−1 of Blue Water (BW). (b) Graphical illustrations of the dose response results presented in (a). (c) Relative maximum population size (%) after the first growth phase (see insert) for some of the Vibrio strains presenting a diauxic growth curve and exposed to 10 µg mL−1 and 25 mg mL−1 of BW. (d) Graphical illustrations of the screening experiment results presented in (c). Significant growth inhibitions are presented in black, growth stimulations in red, and no observed effects in green. Asterisks (*) indicate a statistical difference with the control, and letters (a,b) indicate significant differences between the two BW concentrations tested.*, a, b; **, aa, bb and ***, aaa, bbb respectively indicate p value < 0.05, p value < 0.01 and p value < 0.001. Values are means ± SE (n = 3).

