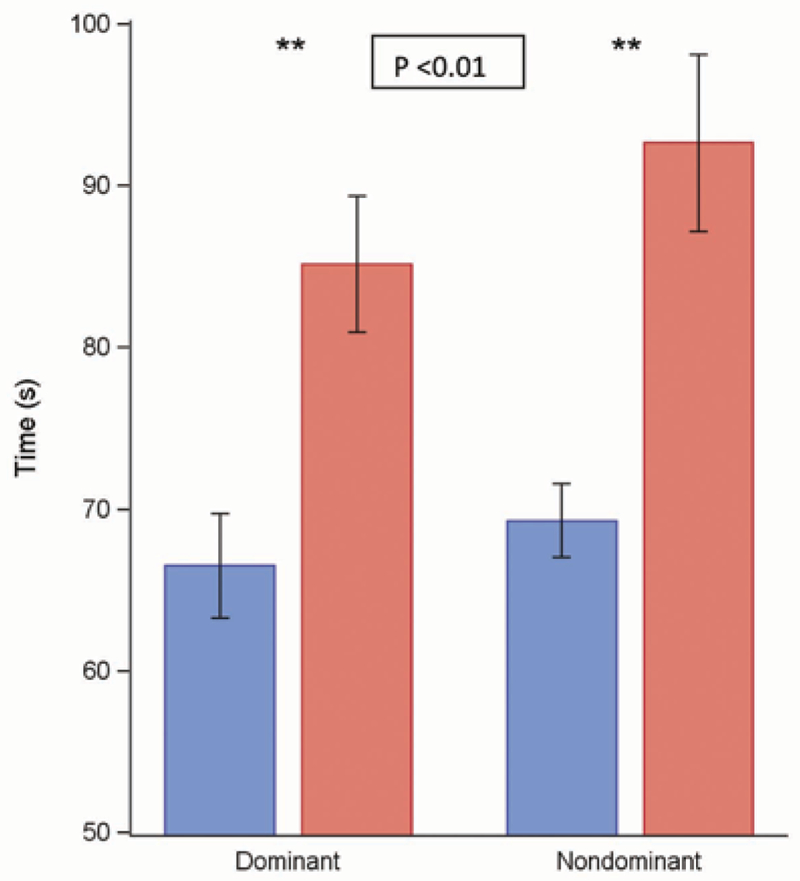
Fig. 3.

Grooved pegboard test. A Wilcoxon Rank Sum test was used to compare measurements between 2 groups of patients. Bar graphs show the means ± standard error (black line) of the grooved pegboard test (in seconds) at the dominant and nondominant hand in the healthy volunteer group (n = 23 in blue) and the patient group (n = 25 in red). The skin test sites show a statistically significant difference control between the groups (P < 0.05).
