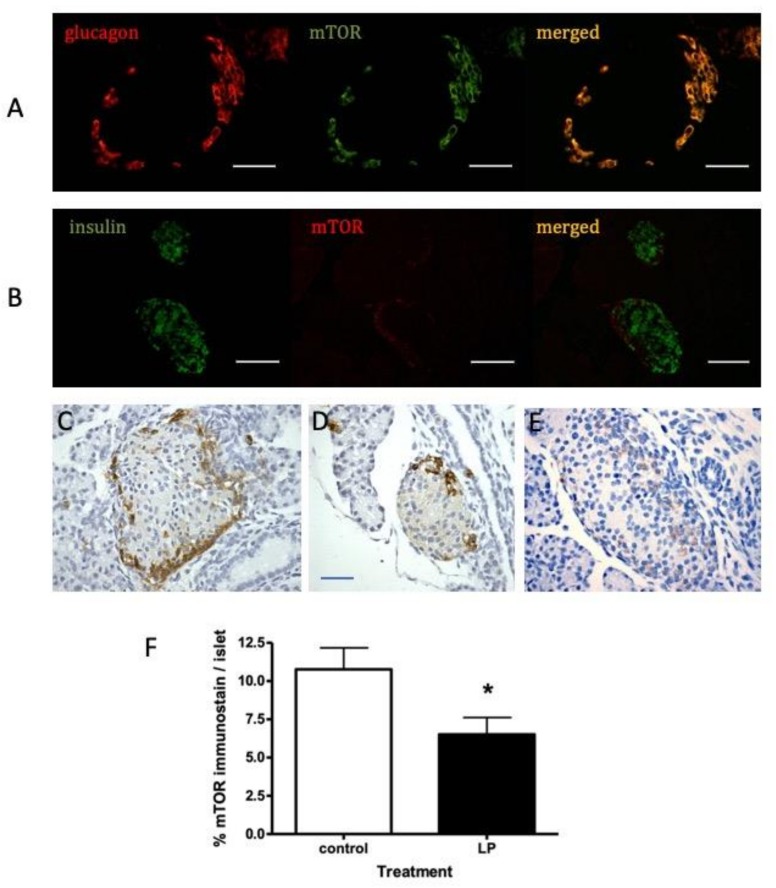
Figure 2.
Representative images of immunofluorescent staining showing co-localization of (A) glucagon (red) and mTOR (green) and (B) insulin (green) and mTOR (red) in pancreatic islets from control-diet fed mouse at age 30 days (6 mice examined). Immunohistochemical localization of mTOR in similar islets is shown using diaminonezidine (DAB) chromogen in islets from 7 day old control diet-fed mice (C,D) or LP diet (E). The percentage area of islets occupied by mTOR-positive cells is shown for control or LP diet-fed mice in panel F (mean ± SEM; n = 6, * p < 0.05 vs. control diet). Scale bars represents 50 µm.

