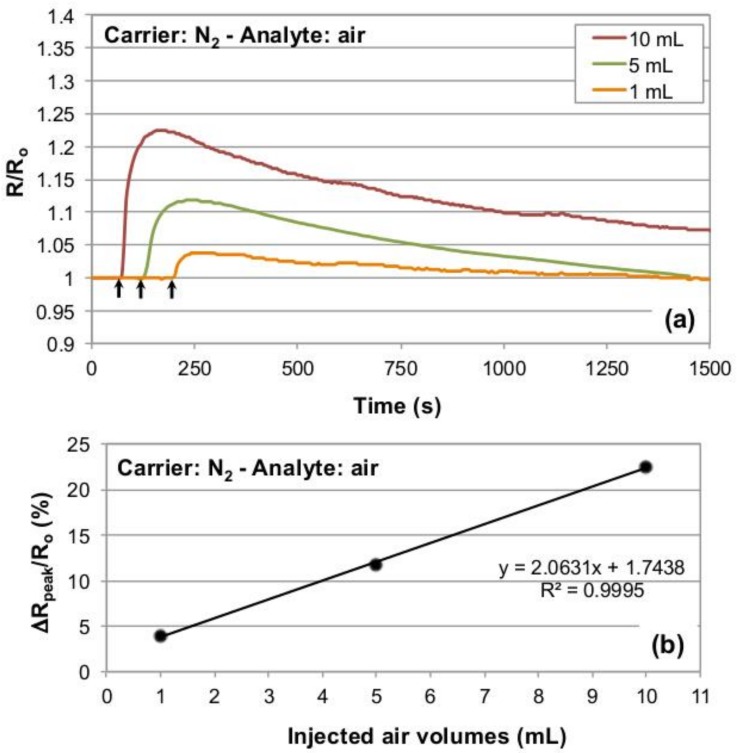
Figure 2.
(a) Normalized resistance traces obtained from a Figaro commercial sensor operated in nitrogen and exposed to different amounts of laboratory air at 25 °C. As it can be noticed, increasing injected volumes result in progressively higher peak heights. The black arrows mark the end of the analyte injection procedure (approximately three-four seconds prior to observe the sensor response onset. This relatively long time is attributed to the steel mesh protecting the Figaro sensing surface, see the Discussion part for details). (b) Percentage resistance change with respect to baseline for the injected gas analyte volumes used to validate the testing chamber.

