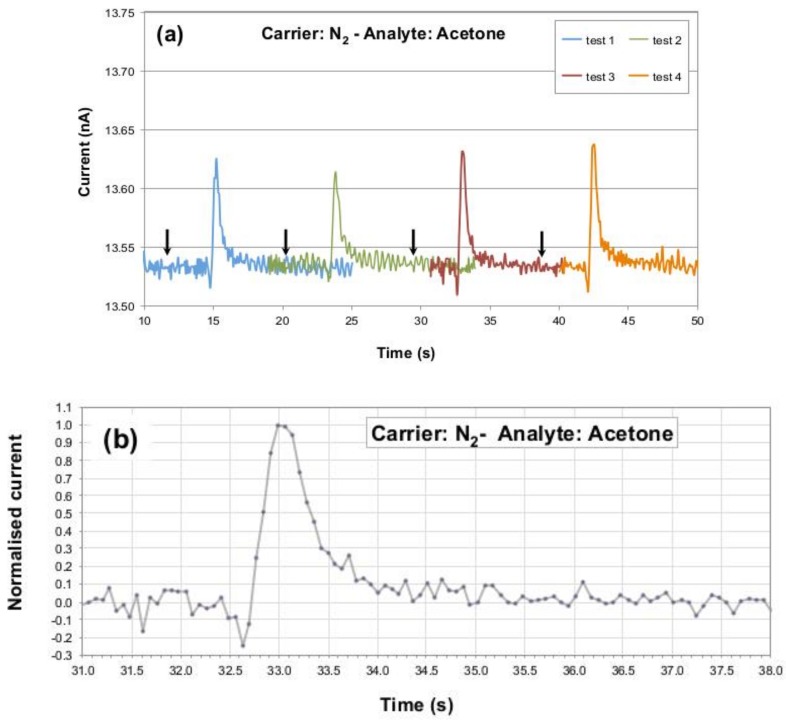
Figure 3.
(a) Repeated tests for P3HT nanofibers sensors against 3.5 ppm of acetone in nitrogen as carrier gas at 25 °C. (b) Normalised current data collected from a P3HT nanofibers-based sensor exposed to 3.5 ppm of acetone in nitrogen as gas carrier at 25 °C. In panel (a) the black arrows mark the end of the analyte injection procedure (approximately 3 s prior to observe the sensor response onset). In panel (b) the injection occurred at around second 30 (not shown, to evidence the perfect baseline recovery occurring in a few seconds after the signal peak).

