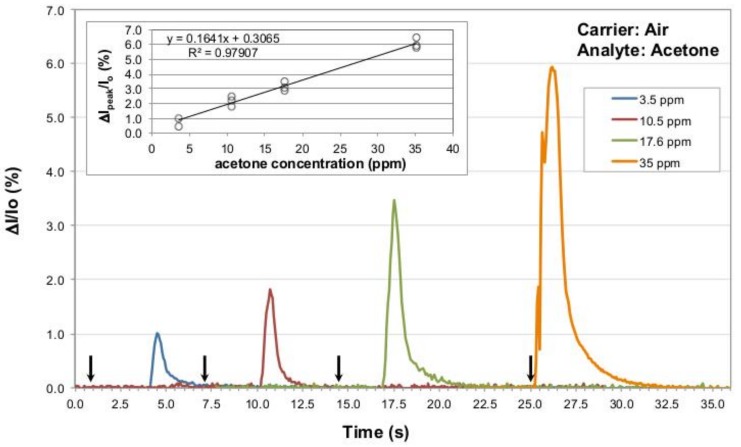
Figure 5.
Current percentage change normalized to the baseline current I0 for a P3HT nanofibers sensor tested versus increasing acetone concentrations (namely 3.5, 10.5, 17.6 and 35 ppm) in air as the gas carrier, at 25 °C. The black arrows mark the end of the analyte injection procedure (approximately three seconds prior to observe the sensor response onset; for the 17.6 ppm this time was a bit lower, about 2.5 s, and for the 35 ppm the time was extremely short, around 0.1–0.2 s). The inset shows the linear relation between the ΔIpeak/I0 ratio and the corresponding tested acetone concentrations for all injections conducted in air as the gas carrier.

