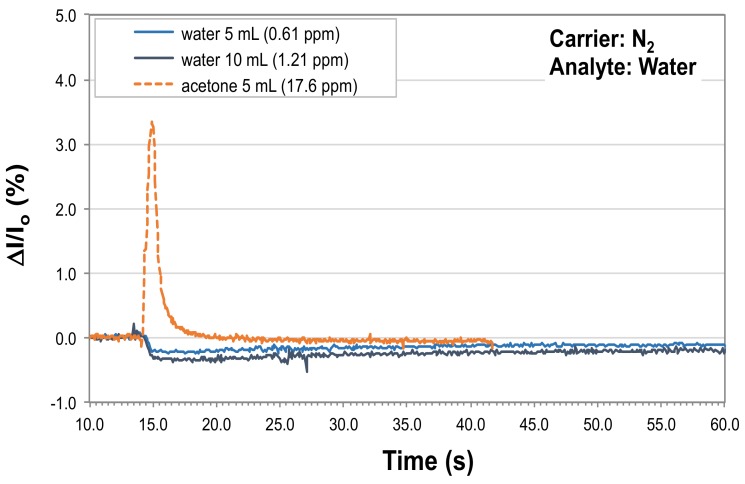
Figure 6.
P3HT NF-sensor response to injections of 5 mL (cyan curve) and 10 mL (dark grey curve) of water vapor saturated at 25 °C, using nitrogen as the carrier gas and the same experimental conditions (carrier flow rate, temperature and ambient pressure) used along tests carried out to measure in-flow acetone response of P3HT NF sensing elements. The orange dashed curve represents the response of the sensing element to 5 mL of acetone. In the inset: magnification of the response of the sensing element to 5 and 10 mL of water vapor (cyan and dark grey curve, respectively).

