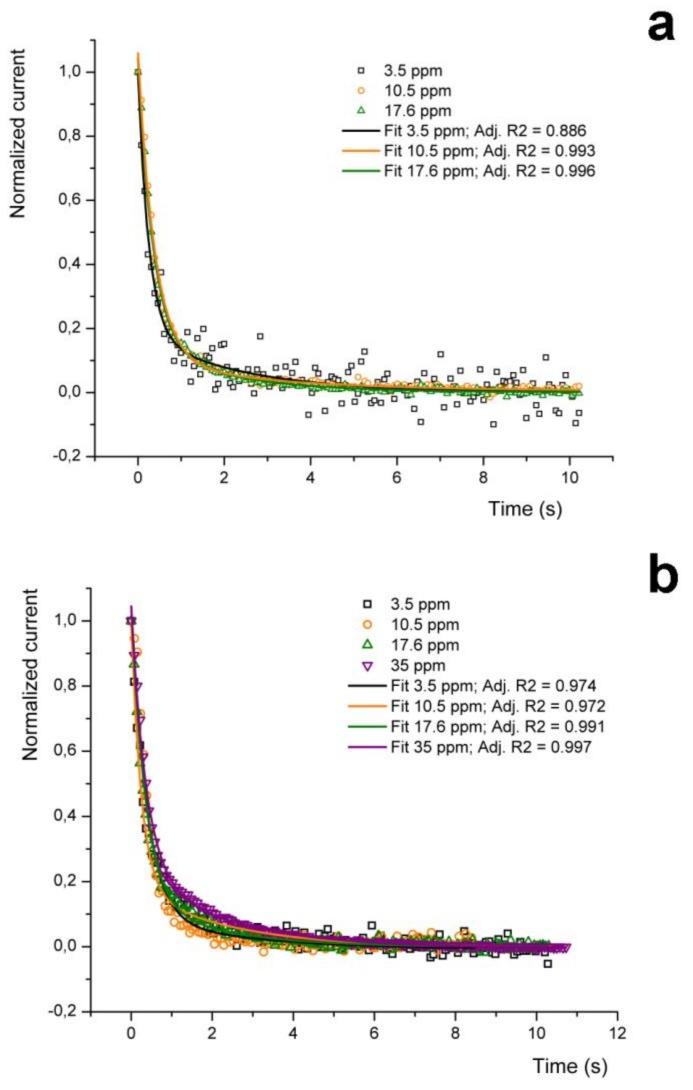
Figure 7.
(a) Normalised current plots representing descending P3HT nanofibers sensor’s traces after exposure to the gas analyte (acetone at 3.5, 10.5 and 17.6 ppm) in nitrogen as the carrier gas, at 25 °C. (b) Normalised current plots representing descending portions of P3HT nanofibers sensor’s traces after exposure to the gas analyte (acetone at 3.5, 10.5, 17.6 and 35 ppm) in air as the carrier gas, at 25 °C.

