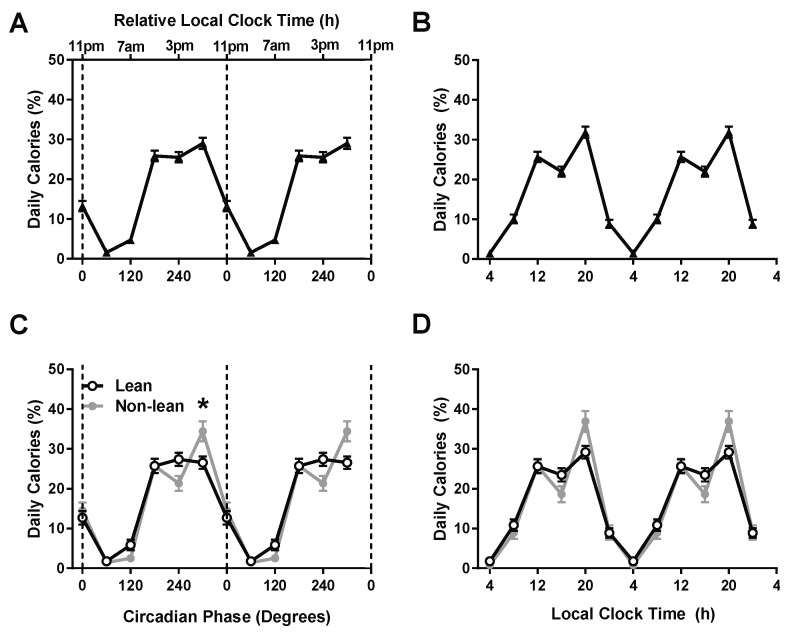
Figure 1.
Caloric intake across circadian phases and local clock time. Influence of circadian and local clock timing on percentage of daily calories in all participants (A,B) and between lean and non-lean participants (C,D). All participants (n = 106) are denoted as triangles, the lean group (n = 68) is denoted by open circles and the non-lean group (n = 38) by closed gray circles. Data are double plotted across circadian phase (0° denotes timing of dim-light melatonin onset) and relative local clock time based on the group average dim-light melatonin of ~23:00 or across local clock time. The * symbol denotes a significant difference after Bonferroni correction (p = 0.007) between lean and non-lean groups. Error bars represent standard error of the mean.

