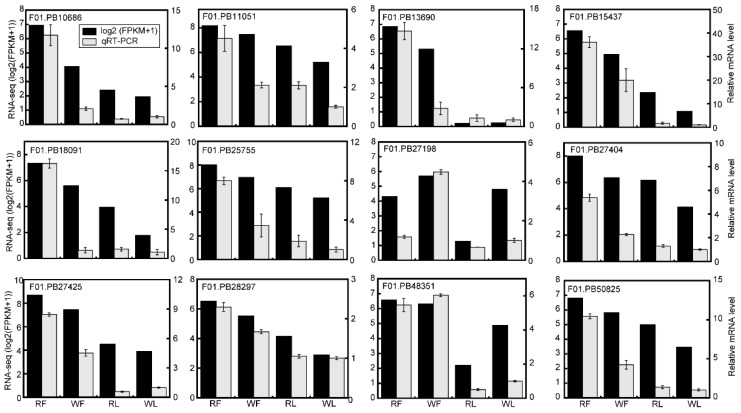
Figure 6.
Expression of anthocyanin biosynthesis-related unigenes quantified by RNA-seq (RNA sequencing) and qRT-PCR (Quantitative real-time PCR) analysis. The left y-axis indicates the log2(FPKM+1) values of unigenes from RNA-seq data (black columns). The right y-axis indicates relative gene expression levels analyzed by qRT-PCR (white columns), and the expression of WL was chosen as the control standardizing all samples, values are presented as mean ± SE (n = 3).

