. 2019 Mar 12;10(15):4306–4312. doi: 10.1039/c8sc05178j

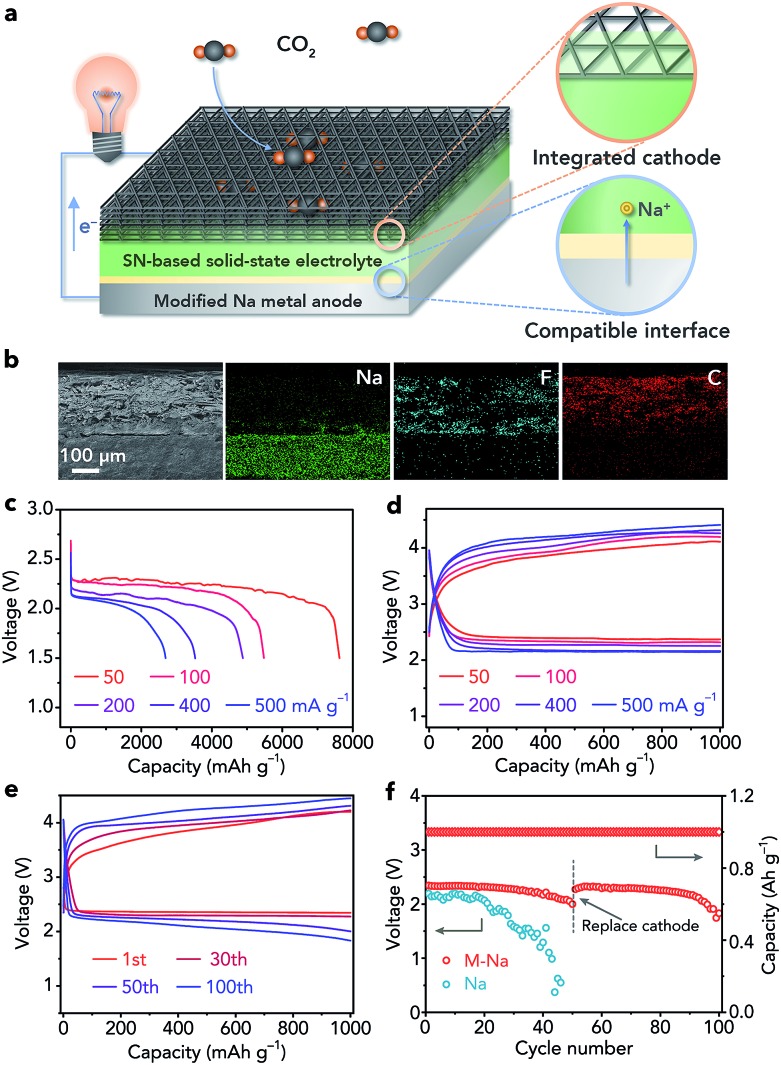
Fig. 5. Configuration and electrochemical performance of all-solid-state Na–CO2 batteries. (a) Schematic illustration, and (b) cross-sectional SEM image and corresponding elemental maps (Na, F, and C) of the batteries. (c) Discharge curves with a cutoff voltage of 1.5 V, and (d) rate performance at different current rates (50, 100, 200, 400, and 500 mA g–1). (e) Discharge/charge profiles with a controlled specific capacity of 1000 mA h g–1 at 200 mA g–1 in selected cycles. (f) The terminal discharge voltages of batteries with the pristine and modified Na anode during cycling; the integrated cathode was replaced with a fresh one after 50 cycles.

Fig. 5