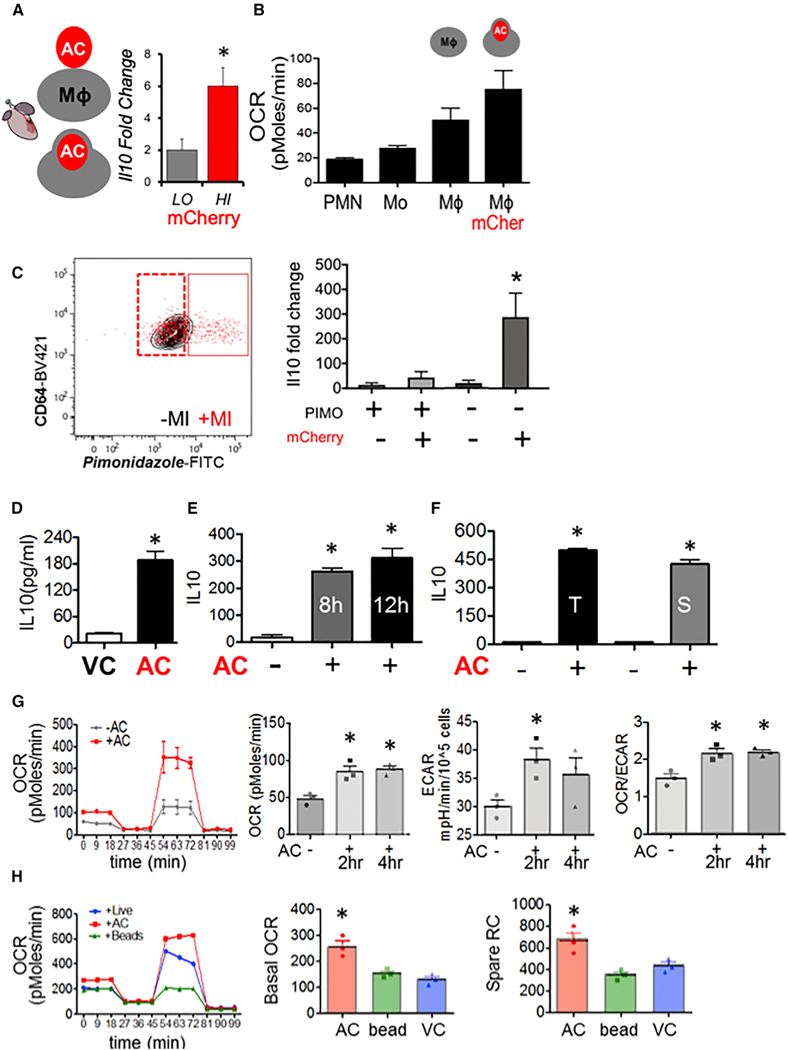
Figure 1. Tissue Injury Phagocytes in the Process of Efferocytosis Produce IL-10 and Exhibit a Mitochondrial Bias.

(A) In a model of tissue injury, B6 mice transgenic for cardiac-specific (Myh6-Cre) expression of mCherry were subject to myocardial infarction (MI). Cardiac extracts were prepared and flow cytometry employed to isolate cardiac macrophages (Mf s) (CD11b+F4/80+Ly6g—CD64+) that included low (LO) and high (HI) mCherry+ dying and apoptotic cells (ACs). mCherry-LO and -HI phagocyteswere sorted and relative gene expression normalized to β2m as assessed by qPCR and plotted as fold change over IL-10 from Mᶲs from naive hearts. (B) Cardiac Ly6g+ neutrophils (PMN), LycHI, Ly6g— monocytes (Mo), CD64+ Mfs, and Mᶲs staining for mCherry were interrogated for basal OCR by functional respiration analysis. (C) Cardiac Mfs were stained with hypoxia probe PIMOnidazole and mCherry and sorted for qPCR. (D-F) Elicited primary Mᶲs were co-cultivated with early (Annexin V positive, propidium iodide negative) ACs. Non-engulfed cells were removed from adherent phagocytes, and cell culture medium was analyzed for secreted cytokines. (D) IL-10 responsewith viable Jurkat cells (VCs) versusACs. (E) Time course analysis of IL-10 production. (F) IL-10 secretion after adding primary thymocytes (T) or primary splenocytes (S). (G) OCR of primary elicited Mᶲs ± indicated treatments and quantified basal OCR. To ascertain basal and spare respiratory capacity (SRC), efferocytes were administered sequential treatments ofoligomycin, CCCP, and rotenone plus antimycin. Minutes 0–18 is basal OCR and 54–81 min is SRC. Area underthe curve quantifications are displayed. Also measured was the extracellular acidification rate (ECAR) as a reflection of glycolysis. (H) Mᶲs were co-cultivated with inert beads and/or live cells.
