
Figure 2. Global Metabolomic Profile of Efferocytosis Highlights FAO Utilization.
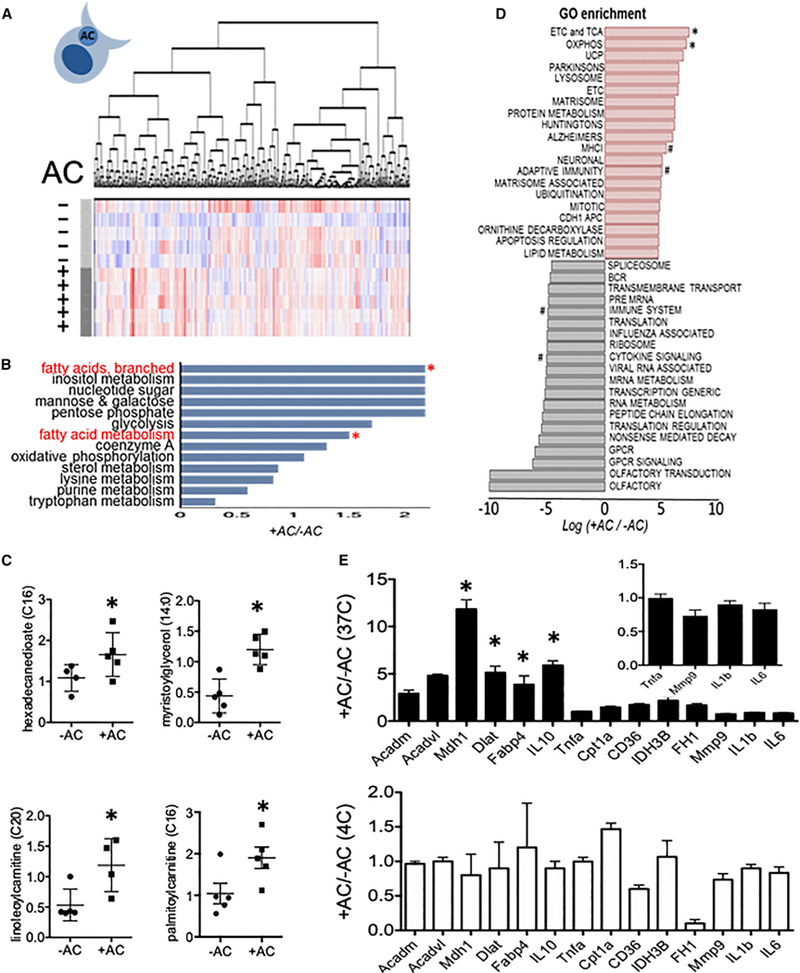
(A) Heatmap after unsupervised hierarchical clustering of metabolitesfrom primary peritoneal Mᶲs, minus (−) versus plus(+) apoptotic cells (n = 5 percondition). Shades of red and blue indicate an increase or decrease of metabolites, respectively. (B) Metabolite set enrichment analysis of significantly altered core pathways. Asterisks indicate pathways of interest. (C) Selected lipid metabolites of interest. (D) Gene ontology analysis after mRNA sequencing screen. # indicates pathways of interest. (E) qPCR validation of selected FAO, lipolysis, TCA, and inflammatory genes versus control (non-filled bars in bottom panel). *p < 0. 05. Inset is magnification of data < 1.