Figure 2.
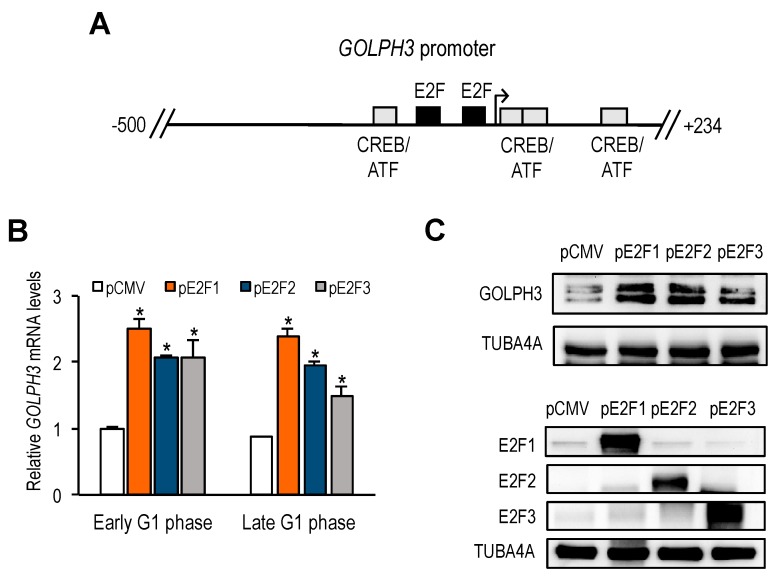
Identification of GOLPH3 regulatory sequences. (A) Schematic representation of transcription factor-binding sites in human GOLPH3 regulatory region (−500 to +234). E2F and ATF/CREB motifs are indicated as boxes. The transcriptional start site is depicted with an arrow. (B) RT-qPCR analysis of GOLPH3 mRNA expression in U2OS cells transfected with plasmids encoding E2F1, E2F2 or E2F3 proteins under CMV promoter, synchronized with Thy-Noc and subsequently released into the cell cycle. Expression values were normalized to the expression of EIF2C2, used as standard control. Data are represented as fold-change (mean ± SD) relative to values of cells transfected with empty pCMV vector. *, p < 0.05. (C) Western analysis of GOLPH3 protein levels in U2OS cells overexpressing E2F1-3. Bottom panel shows E2F1, E2F2 and E2F3 protein levels after transfection of each E2F expression plasmid. Shown are the results of one representative experiment of three independent experiments.

