
Figure 3:
Difference in Payments for Enrollees with Selected “Healthy” and “Sick” Indicators with and without Changing the Data
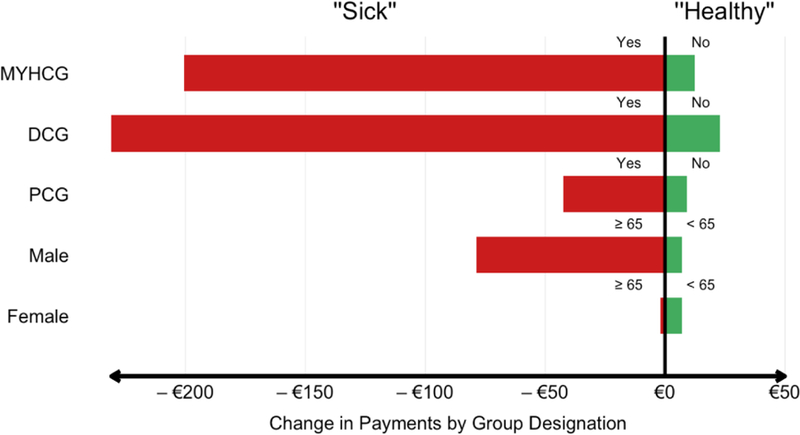
Notes: MYHCG multiple-year high cost group; DCG: any DCG; PCG. For each mutually exclusive partitioning of the population the payment changes weighted by group size sum to zero. Change in payments for the four groups, male < 65, male ≥, female < 65, and female ≥, must sum to zero.