Figure 1.
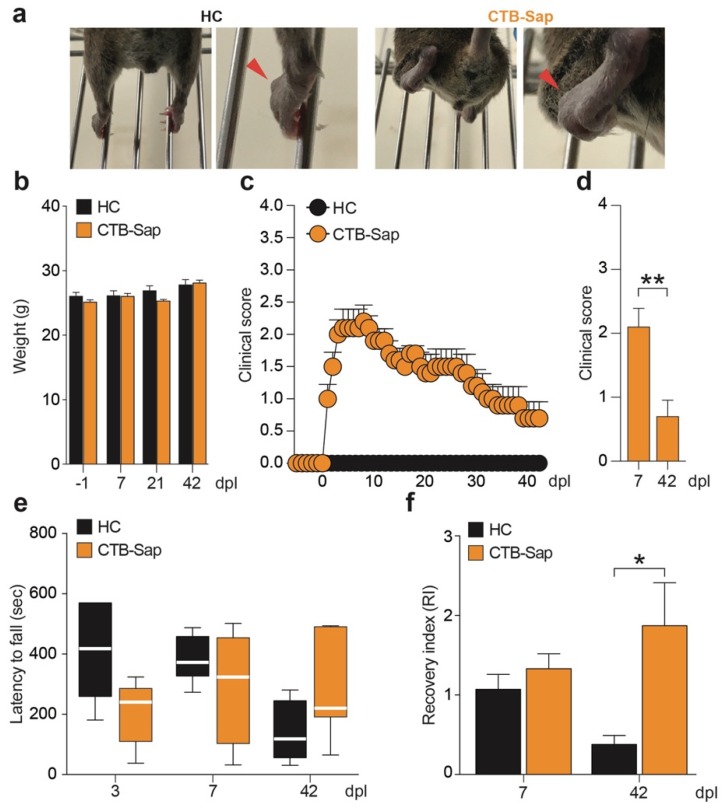
Behavioral impairment induced by selective spinal MN ablation. (a) Representative pictures of hindlimbs of HC and CTB-Sap lesioned mice; red arrows indicate the capability in HC or the lack of toes spreading of the left hindlimb of CTB-Sap mice; (b) HC and CTB-Sap mice body weight at −1, 7, 21 and 42 day post lesion (dpl); data are shown as mean ± SEM; (c,d) clinical score during the time course of motor impairment (c) and bar plots at 7 and 42 dpl (d); data are shown as mean ± SEM; ** p-value < 0.01; unpaired t-test. (e) Latency to fall expressed in sec on rotarod test at 3, 7, and 42 dpl in HC and CTB-Sap lesioned mice; data are expressed as standard box-and-whiskers plot in which the central-line represents the median and the upper and lower bounds are min and max value; (f) recovery index (RI) of HC and CTB-Sap mice at 7 and 42 dpl over index at 3 dpl. Data are expressed as mean ± SEM; * p-value < 0.05; one-way ANOVA and Holm-Sidak’s multiple comparisons test.

