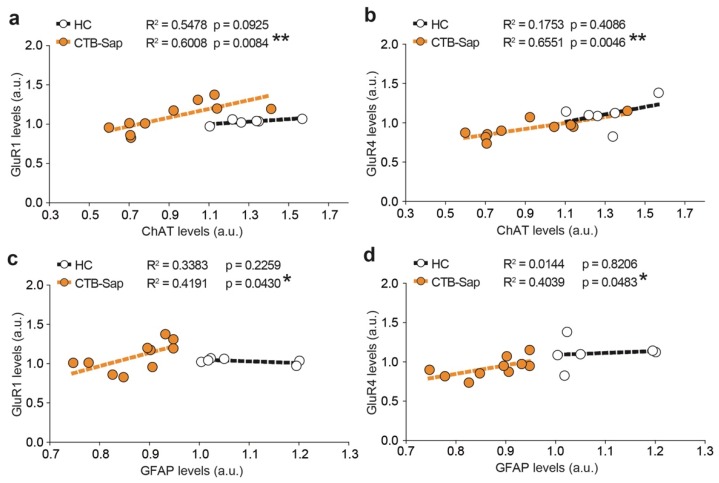
Figure 8.
Significant correlations between spinal MNs and astrocytes and AMPA subunits, GluR1 and GluR4. (a,b) Linear regression analysis of GluR1 (a) or GluR4 (b) levels and ChAT levels; ** p-value < 0.01. (c,d) Linear regression analysis of GluR1 (c) or GluR4 (d) levels and GFAP levels; * p-value < 0.05.

