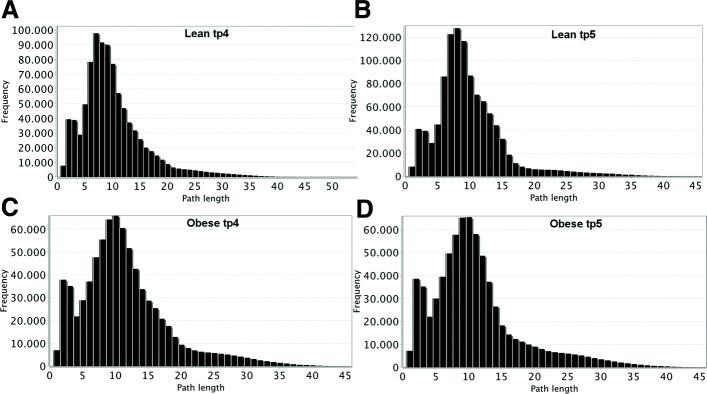
Fig. 3.
Shortest path distributions. Distribution of shortest paths shows that in lean networks, at both time points (a-b), path lengths of 7 and 8 nodes have the highest frequency, respectively. Instead, in case of obese networks (c-d), the most predominant length is 10 steps, indicating longer paths to connect two given nodes

