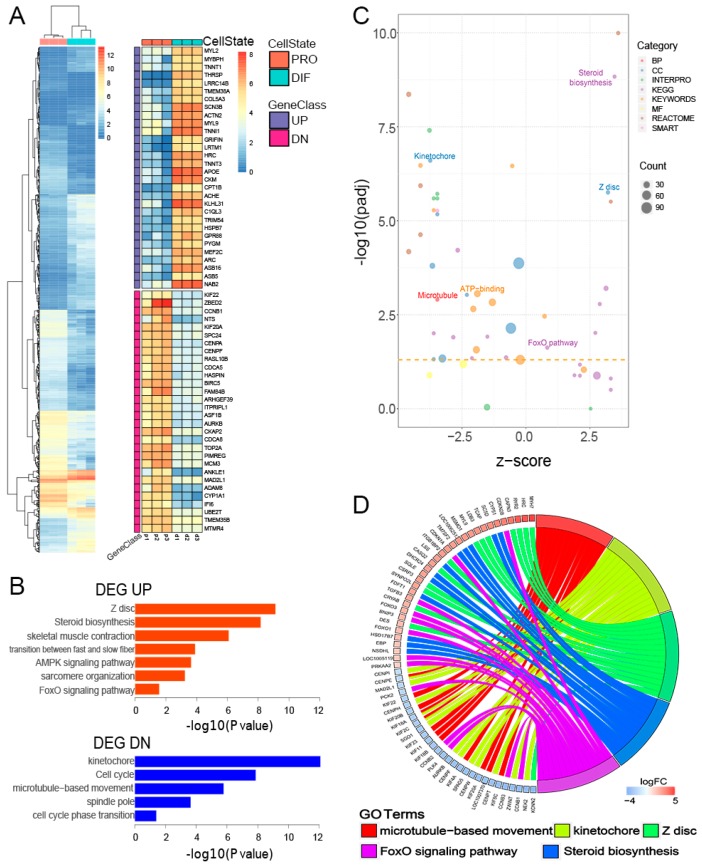
Figure 2.
Transcriptomic profiles of PRO and DIF PSCs. (A) Heatmap of 917 differentially expressed genes (DEGs) interrogated between PRO and DIF cells. Sixty significant DEGs of up- and down-regulated genes illustrated the transcriptional patterns in two cell phases. (B) Gene ontology (GO) analysis of up- (UP) and down- (DN) regulated DEGs changed during cell differentiation. The enriched terms were ranked by -log10(p value). (C) The GO term enrichment was displayed, which was calculated using z-score for functional clusters, and six myogenesis-related GO terms were highlighted in the bubble plot. (D) The five most important pathways and biological processes were identified, and the DEGs were selected to reveal their function in muscle formation.

