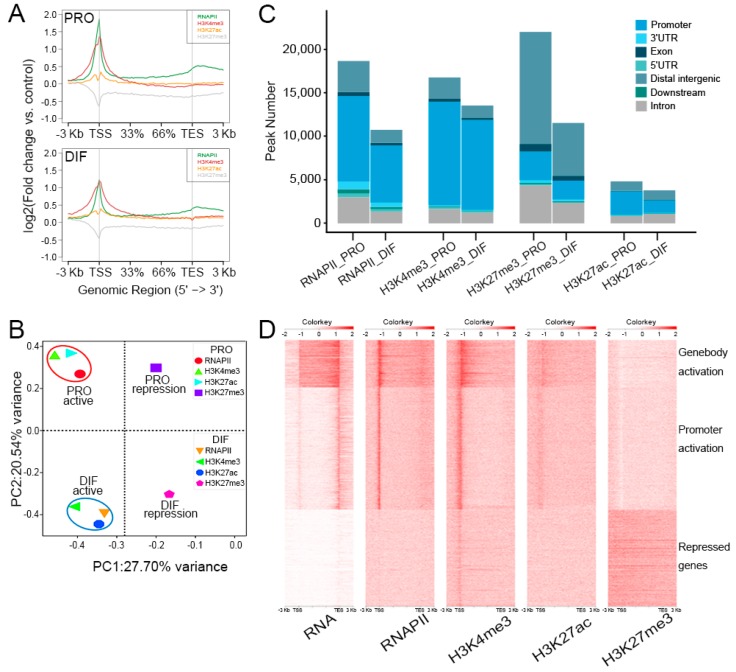
Figure 3.
The insight of epigenomic alteration during PSCs differentiation. (A) Chromatin Immunoprecipitation Sequencing (ChIP-Seq) enrichment were plotted at −3 kb of the transcription start site (TSS) and +3 kb of the TES to show the presumable binding sites of three epigenetic marks and RNA polymerase Ⅱ (RNAPII) of PRO (upper panel) and DIF (bottom panel) cells. The y-axis was the average log2 fold change compared with control. (B) Data from three histone modifications and RNAPII between PRO and DIF cells were clustered into four parts according to cell phases and histone functions, which showed the distinction of histone modifications during cell differentiation. The first and second principal components were depicted as x-axis and y-axis. (C) The peak numbers of three epigenetic marks and RNAPII were described, and chromatin was illustrated into seven parts to show the distribution of modification peaks. (D) ChIP-Seq enrichments were plotted using a heatmap, which demonstrated the depositing of three histone modifications and RNAPII, and the correlation associated with gene expression profiles of myotubes. Maps were generated from 3 kb upstream of the TSSs to 3 kb downstream of the TESs. Three clusters were labeled according to gene expression and histone modification levels.

