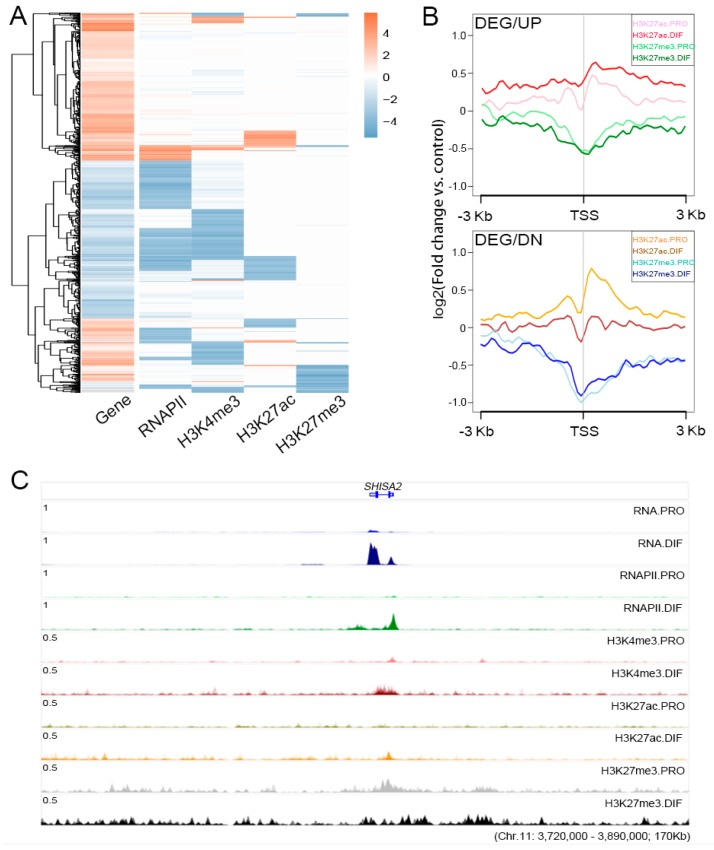
Figure 4.
The relationships between epigenetic modifications and transcriptomic profiles during cell differentiation. (A) Heatmap illustrating the relationships between the changes of histone modifications and gene expression for the 917 DEGs during cell differentiation. (B) Expression profiles of H3K27ac and H3K27me3 were plotted at ±3 kb of TSS region of DEGs to show the presumable binding sites between PRO and DIF cells. Up (DEG/UP, upper panel) and down (DEG/DN, bottom panel) regulated DEGs were described separately. The y-axis was the average log2 fold change compared with control. (C) The integrative genomics viewer (IGV) browser was used to show ChIP-Seq and RNA Sequencing (RNA-Seq) enrichment for the up-regulated DEG, SHISA2, which showed that the gene was activated by the increase in RNAPII and H3K27ac combined with the depletion of H3K27me3 modification during cell differentiation.

