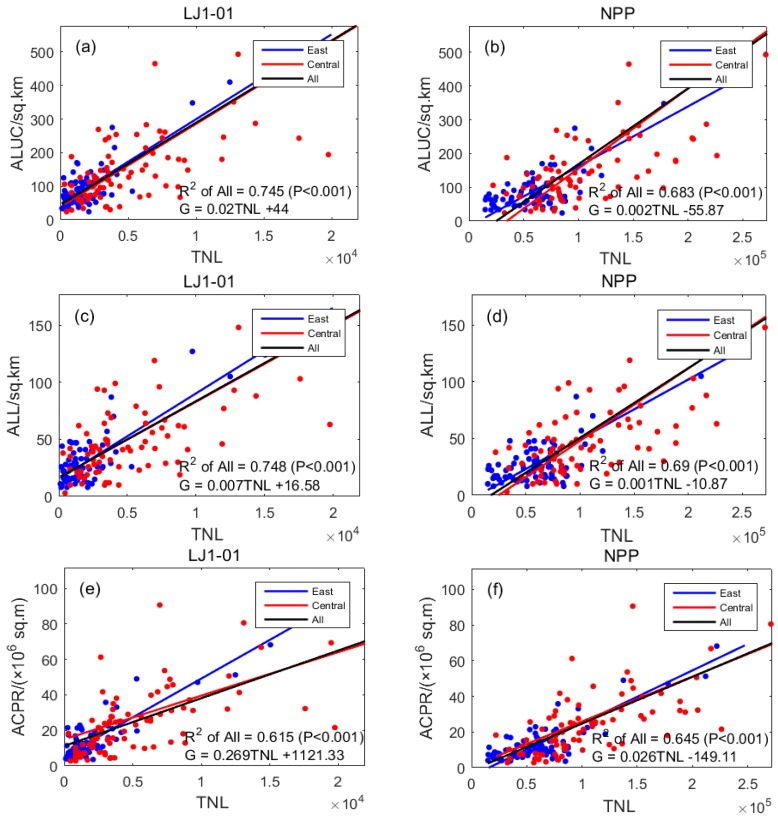
Figure 6.
Scatter diagrams for the linear regression results of area of land in use and TNL: (a) the TNL of LJ1-01 data and ALUC; (b) the TNL of NPP/VIIRS data and ALUC; (c) the TNL of LJ1-01 data and ALL; (d) the TNL of NPP/VIIRS data and ALL; (e) the TNL of LJ1-01 data and ACPR; (f) the TNL of NPP/VIIRS data and ACPR.

