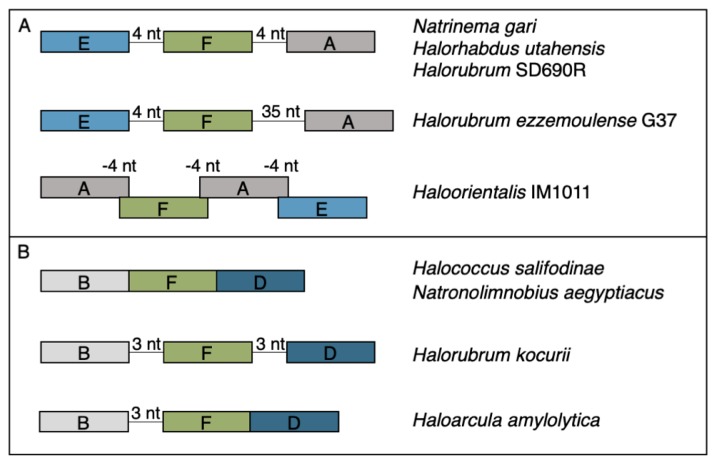
Figure 3.
Gene maps for syntenic clusters of gene families (A) EFA and (B) BFD found in a subset of organisms identified to the right of each map. Genes are colored by gene families with Type I methylases (families A and B) in grays, Type I restriction endonucleases (DE) in blues, and Type I site specificity unit (F) in green.

