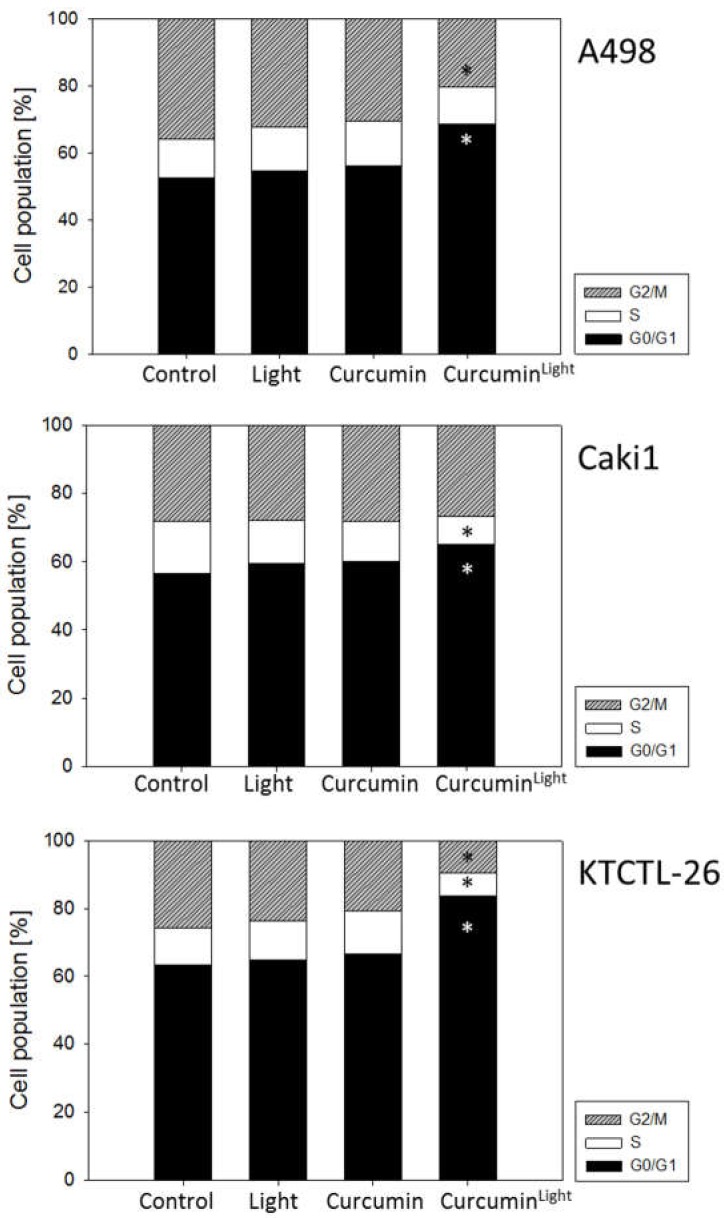
Figure 5.
Cell cycle analysis of A498, Caki1, and KTCTL-26 cells treated with 0.2 µg/mL curcumin for 1 h, with or without irradiation (controls remained untreated). Analysis was done 24 h following curcumin exposure. The cell population is expressed as a percentage of the total cells analyzed. One representative experiment of three is shown. Mean SDinterassay < 40%, mean SDintraassay < 10%. * Indicates significant difference to control.

