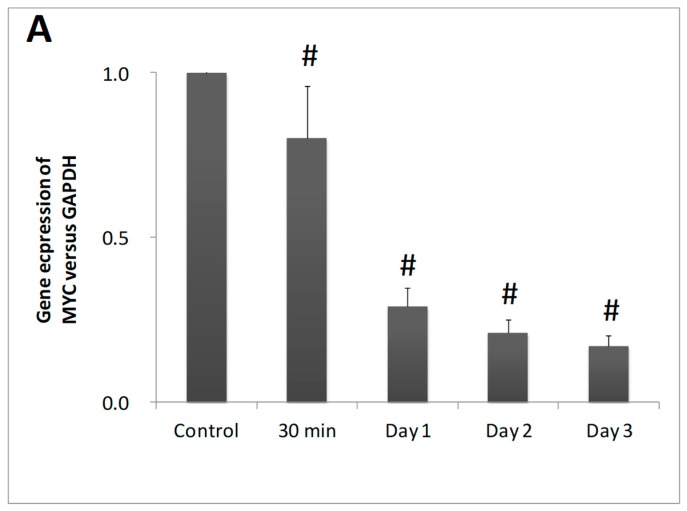
Figure 2.
Effect of DHA treated EoL-1 cells upon MYC-mRNA levels. MYC-mRNA levels from EoL-1 cells in the absence (control) or presence of 10 μM DHA by qRT-PCR analysis (n = 3, in duplicates). The symbol # denotes statistically significant differences of p < 0.05 versus control. t-Test analysis for independent samples was applied by Statistica software.

