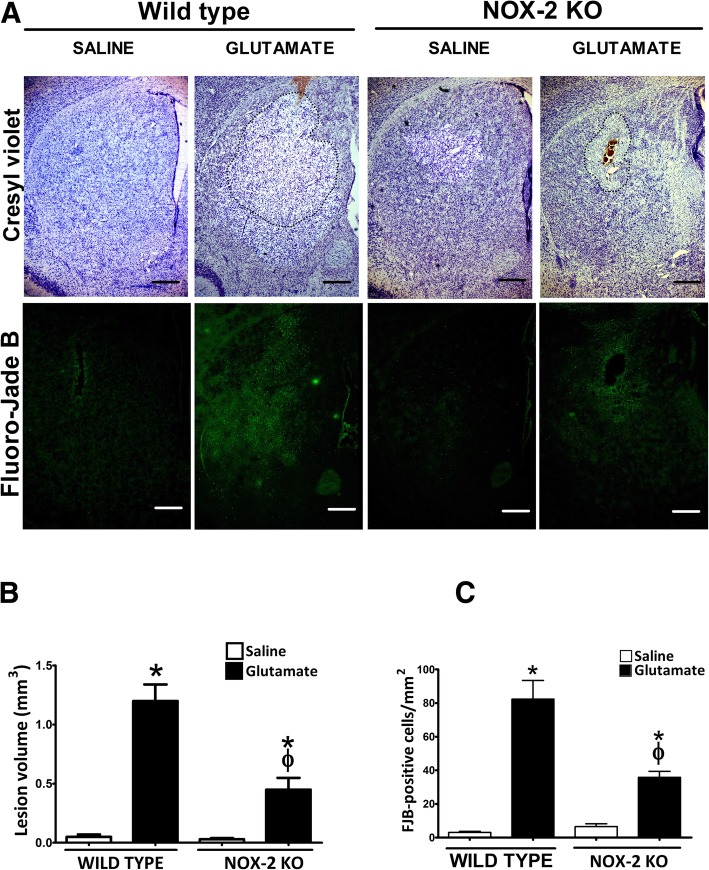
Fig. 2.
Lesion area and neuronal degeneration in wild-type and NOX-2 KO mice injected with glutamate in the striatum. Histological sections were obtained after 24 h of intracerebral administration of saline (NaCl 0.9%) or glutamate (1 M) as detailed in the “Methods” section. a Representative micrographs of coronal striatal sections showing striatal lesions stained with cresyl violet and damaged cells positive to Fluoro-Jade B. The dotted line delimits the area of lesion of mice treated with glutamate. The scale bars represent 200 μm. b Quantification of the lesion volume 24 h after saline or glutamate injection is expressed in cubic millimeters. c Total number of FJB-positive cells counted in three slices per mice. Data are expressed as means ± SEM of five independent experiments. *p < 0.05 vs the corresponding saline control; ϕp < 0.05 vs wild-type mouse (WT) treated with glutamate

