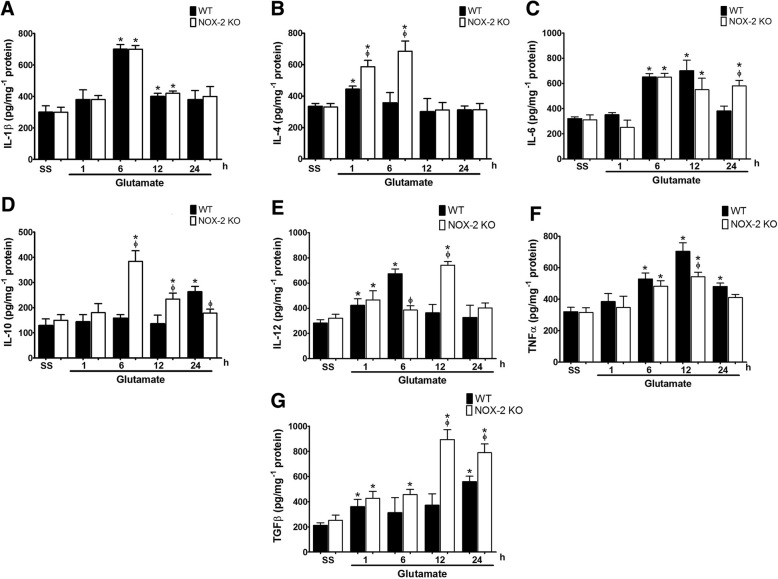
Fig. 6.
Pattern of cytokine production in wild-type and NOX-2 KO mice after the striatal injection of glutamate. Characterization of the inflammatory response was carried out by determination of cytokines concentration in striatum homogenates of wild-type (WT) and NOX-2 KO mice determined by enzyme-linked immunosorbent assays (ELISA) at 1, 6, 12, and 24 h after administration of saline (SS) or glutamate (1 M) as detailed in the “Methods” section. a Interleukin-1β (IL-1β), b interleukin-4 (IL-4), c interleukin-6 (IL-6), d interleukin-10 (IL-10), e interleukin-12 (IL-12), f tumor necrosis factor α (TNF-α), and g transforming growth factor β (TGF-β). Data are expressed as picograms per milligram of protein and are means ± SEM of three independent experiments. *p < 0.05 vs the corresponding saline control; ϕp < 0.05 vs the corresponding WT mouse treated with glutamate

