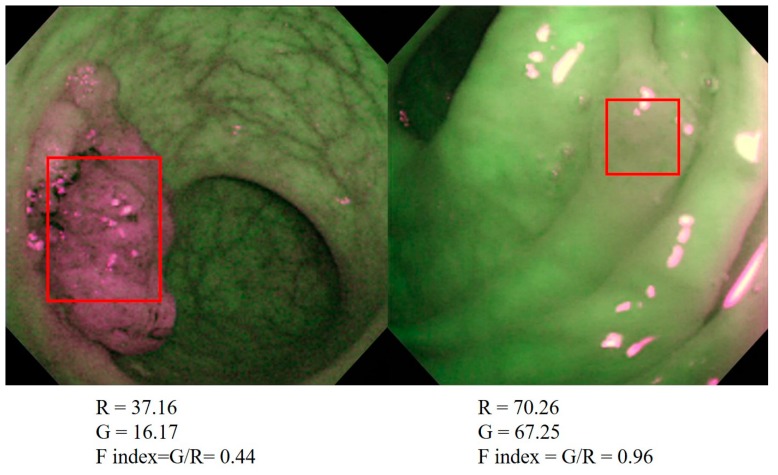
Figure 5.
Quantification of AFI images with a software program used to calculate the F index. AFI images were converted into bitmap-formatted pictures and the tumor area was manually traced. The signal density of either red or green in the traced area was measured and converted to a reverse gamma value, which corresponded to the strength of the output from each CCD signal. The ratio of the reverse gamma value of the green (fluorescence) divided by that of the red (reflection) was defined as the F index.

