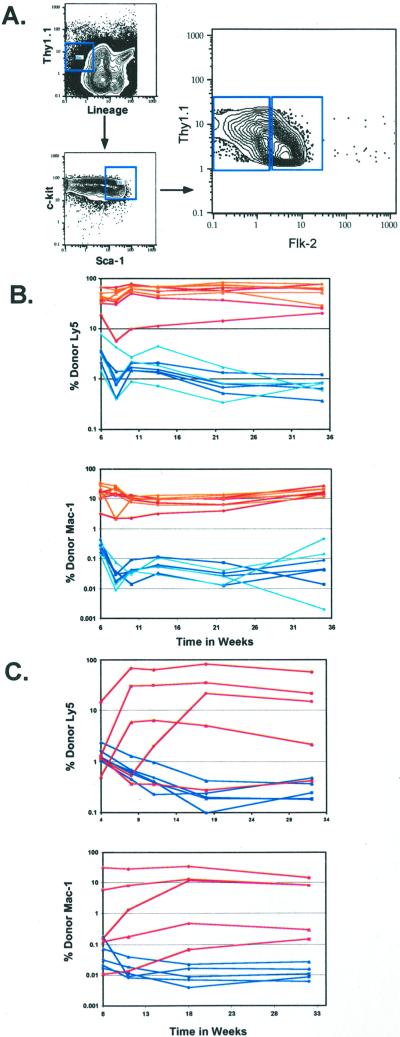
Figure 1.
Heterogeneous expression of Flk-2 on the HSC population. (A) Flk-2 expression was analyzed on the HSC population; Lin−/lo Thy-1.1lo c-kit+ Sca-1+ of c-kit enriched BM. HSCs that were either Flk-2+ or Flk-2− were sorted. Lethally irradiated recipients were competitively reconstituted with 50–100 (B) or 20 (C) Flk-2+ or Flk-2− HSCs plus host-type radioprotective WBM. (B) Fifty Flk-2+ HSCs are shown in blue, 100 flk-2+ HSCs are in light blue, 50 Flk-2− HSCs are in red, and 100 Flk-2− HSCs are in orange. (C) Twenty Flk-2+ HSCs are shown in blue, and 20 Flk-2− HSCs are in red. Peripheral blood was analyzed for donor Ly5 B, T, and myeloid contribution. Each curve represents an individual animal. Because myeloid cells are present in the blood for a short period, myeloid activity is shown as a good indicator of stem cell activity. The background is 0.1%.

