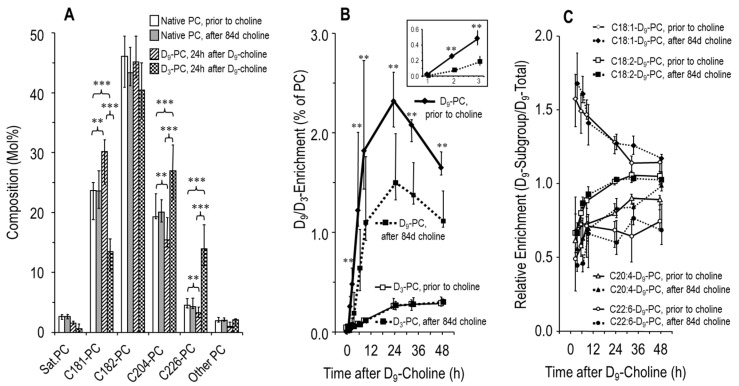
Figure 6.
Molecular composition and kinetics of plasma phosphatidylcholine (PC) in response to choline supplementation. (A) PC molecular species grouped according to their content of different fatty acid residues in sn-position 2 (Sat. PC, C18:1-PC, C18:2-PC, C20:4-PC or C22:6-PC). White panels indicate the median PC composition prior to choline supplementation (visit [V] 2‒4, whereas grey panels are values after 84 d choline supplementation (V6-8). Striped panels indicate the molecular composition of PC synthesized de novo (D9-PC), whereas dotted panels indicate synthesis via methylation of phosphatidylethanolamine (D3-PC) [13,27]. (B) D9- and D3-enrichment of PC prior to and after choline supplementation. (C) The relative synthesis rates and kinetics of plasma PC sub-groups are identical prior to (visit [V] 2–4) and after (V6–8) 84 d choline supplementation. Data are medians and interquartile ranges of N = 10. Abbreviations: ** p < 0.01; *** p < 0.001.

