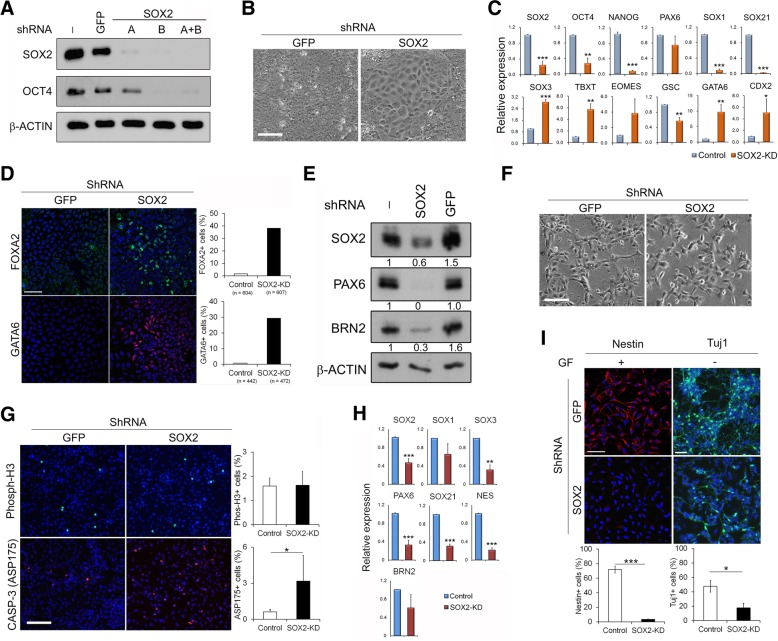
Fig. 1.
SOX2 knockdown in hESCs and NPCs affect their properties. H1 hESCs (a–d) and their derived neural progenitors (e–i) were infected by either SOX2-shRNA or control-shRNA and analysed 7 days later unless indicated. a Representative immunoblot showing knockdown of SOX2 with indicated SOX2 shRNA in hESCs. b Representative images comparing morphology in control and SOX2-knockdown (KD) hESCs with shRNA(A+B). Scale bar = 100 μm. c Transcript levels by qRT-PCR in control and SOX2-KD hESCs. Data are presented as mean ± SD (from 3 independent shRNA transduction experiments of triplicate PCRs for each sample). d Immunostaining with FOXA2 and GATA6 antibodies in control and SOX2-KD hESCs. Left—representative images, scale bar = 50 μm; right—the percentage of positive cells from the numbers of cells counted shown below. e Immunoblot showing reduced PAX6 and BRN2 expression in SOX2-KD NPCs with quantification shown under. f Representative phase-contrast images of control and SOX2-KD NPCs. Scale bar = 100 μm. g Immunostaining with indicated antibodies in control and SOX2-KD NPCs. Left—representative images, scale bar = 50 μm; right—quantitative analysis from 3 independent experiments as in c with > 3000 cells counted in each sample. h mRNA expression by qRT-PCR in control and SOX2-KD NPCs. Data are shown as in c. i Immunostaining with nestin and Tuj1 antibodies. Tuj1 staining was performed after withdrawal of growth factors from NPCs for 7 days. Upper—representative images, scale bar = 50 μm; lower—quantitative analysis from 3 independent experiments with > 2000 cells counted in each sample. *p < 0.05; **p < 0.005 and ***p < 0.0005 by Student t test

