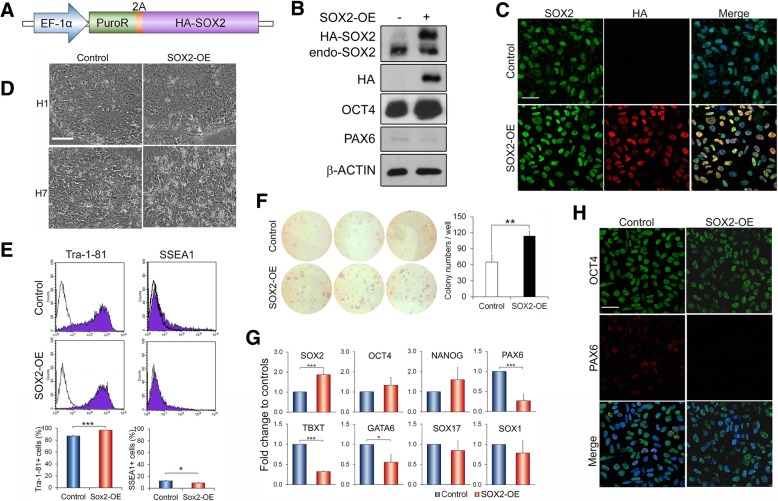
Fig. 2.
Overexpression of SOX2 inhibits spontaneous differentiation in hESC culture under self-renewal conditions. All analyses were done around 30 days post-transduction in H1 hESCs unless indicated. a Schematic of SOX2 overexpression construct and vector containing PuroR only as the control. b Immunoblot of cell lysate isolated from control and SOX2-overexpressing (SOX2-OE) hESCs with indicated antibodies. Both HA-SOX2 and endogenous Sox2 are indicated. c Representative images of indicated hESCs immunostained with SOX2 and HA antibodies. Scale bar = 50 μm. d Phase-contrast images of indicated hESCs in self-renewal cultures. Scale bar = 100 μm. e Flow cytometry analysis of Tra-1-81 and SSEA1 in the indicated hESCs. The upper panels are representative flow cytometry images and the lower histograms are the quantification as mean ± SD from three independent transductions. ***p < 0.001 and *p < 0.05 by Student t test. Similar results were also obtained many passages later. f Colony formation assay with alkaline phosphatase staining in SOX2-OE and control hESCs (> 2 months post-transduction). Representative images of three different OE and their corresponding control cell lines (left) and their counting of triplicate for each line (right). **p < 0.01. g qRT-PCR analysis of gene expression in the indicated hESCs. Data are normalised to control hESCs and presented as mean ± SD from three independent OE experiments of triplicate PCRs for each. h Immunostaining of indicated hESCs with OCT4 and PAX6 antibodies. Scale bar = 50 μm

