Fig. 5.
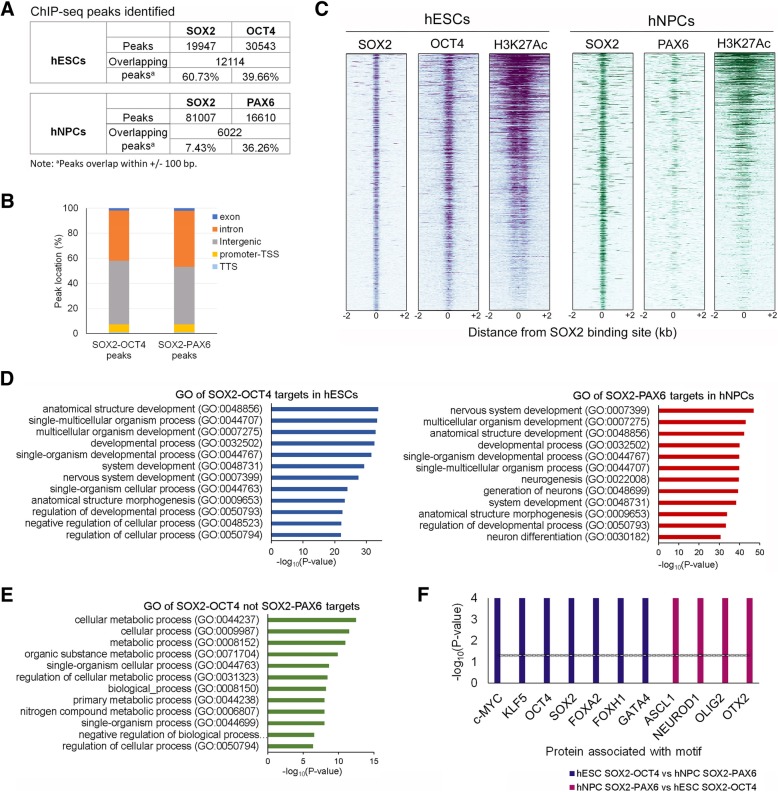
Analysis of SOX2-OCT4 and SOX2-PAX6 targeting genes from ChIP-Seq datasets. a Identification of SOX2, OCT4 and PAX6 peaks from ChIP-Seq datasets in hESCs and hNPCs. b The genomic distribution of SOX2-OCT4 and SOX2-PAX6 overlapping peaks in hESCs and hNPCs, respectively. TSS, transcription start site; TTS, transcriptional terminal site. c Heatmap of SOX2 peaks in hESCs (left panel) and hNPCs (right panel) from ChIP-Seq datasets centred on the SOX2-binding sites (± 2 kb) and ordered top to bottom by signal intensity. OCT4, PAX6 and H3K27ac ChIP-Seq signals associated with the corresponding Sox2-binding sites in the two cell types are shown. d Top 10 biological functions in GO analysis of the nearest genes of SOX2-OCT4-H3K27ac and SOX2-PAX6-H3K27ac overlapping regions in hESCs and hNPCs, respectively. e Top 10 biological functions in GO analysis of the nearest genes of SOX2-OCT4-H3K27ac overlapping regions in hESCs, which are not bound by SOX2-PAX6 in hNPCs. f SOX2-OCT4 (blue bars)- and SOX2-PAX6 (maroon bars)-enriched motifs are associated with transcription factors of different lineages. The black line indicates the background level

