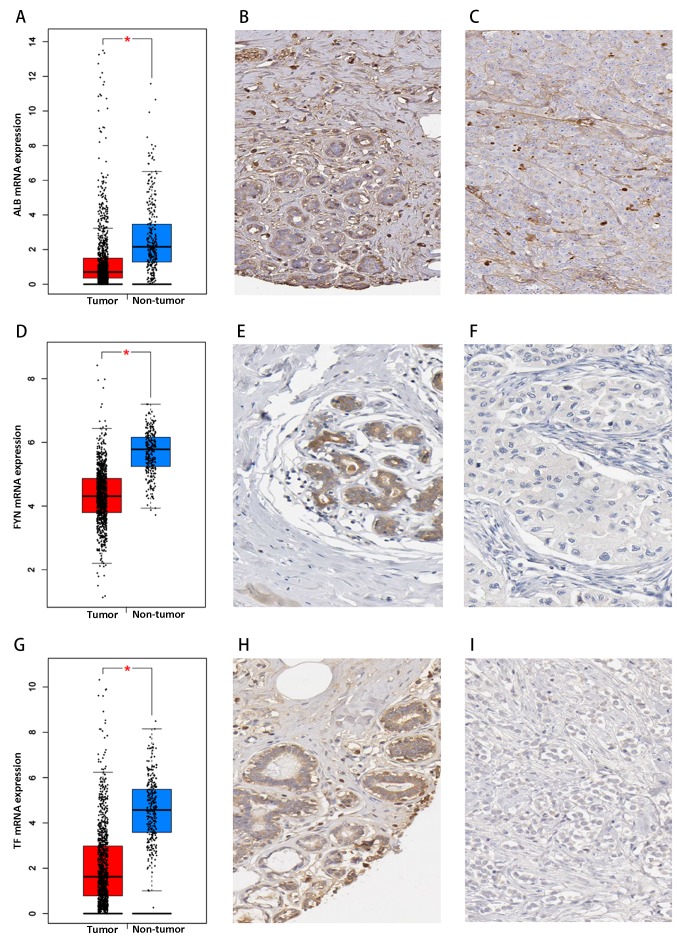
Figure 6.
mRNA and protein expressions of ALB, FYN and TF in breast cancer tissues. (A-I) The GEPIA database, which included TCGA and GTEx RNA-sequencing data, was used to examine (A-C) ALB, (D-F) FYN and (G-I) TF mRNA and protein expression in breast cancer tissues and non-cancerous breast tissues; TPM was used to calculate relative mRNA gene expression levels from 1,085 tumor and 291 non-tumor tissues, which are presented as Log2(TPM + 1) scale. (A) ALB mRNA expression levels from GEPIA. (B) Non-cancerous breast myoepithelial cells stained with HPA031024 anti-ALB antibody (medium staining). (C) Breast cancer tissue stained with HPA031024 anti-ALB antibody (low staining with light brown color in the cytoplasm). (D) FYN mRNA expression levels from GEPIA. (E) Non-cancerous breast myoepithelial cells stained with anti-FYN HPA023887 antibody (medium staining). (F) Breast cancer tissue stained with anti-FYN HPA023887 antibody (low staining with light brown color in the cytoplasm). (G) TF mRNA expression levels from GEPIA. (H) Non-cancerous breast myoepithelial cells stained with HPA001527 anti-TF antibody (medium staining). (I) Breast cancer tissue stained with HPA001527 anti-TF antibody (low staining with light brown color in the cytoplasm). *P<0.01. Immunohistochemistry images in B, C, E, F, H and I are presented at ×400 magnification. ALB, albumin; FYN, FYN proto-oncogene, SRC family tyrosine kinase; GEPIA, Gene Expression Profiling Interactive Analysis database; GTEx, Genotype-Tissue Expression; TCGA, The Cancer Genome Atlas; TF, transferrin; TPM, transcripts per kilobase million.

