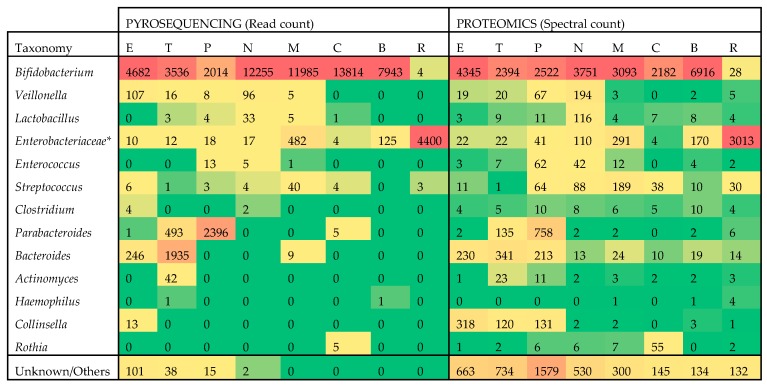
Figure 1.
Heat map comparison of pyrosequencing and metaproteomics results across the most abundant taxa. Data is summarized at the genus level, except for the family Enterobacteriaceae which incorporates multiple genera to simplify comparisons. Values are colored in shades of green to yellow to red, indicating low, medium and high abundance, respectively. Actual read counts and spectral counts are also provided. Subjects are identified by a letter code here and in other figures and tables (E, T, P, N, M, C, B, R).

