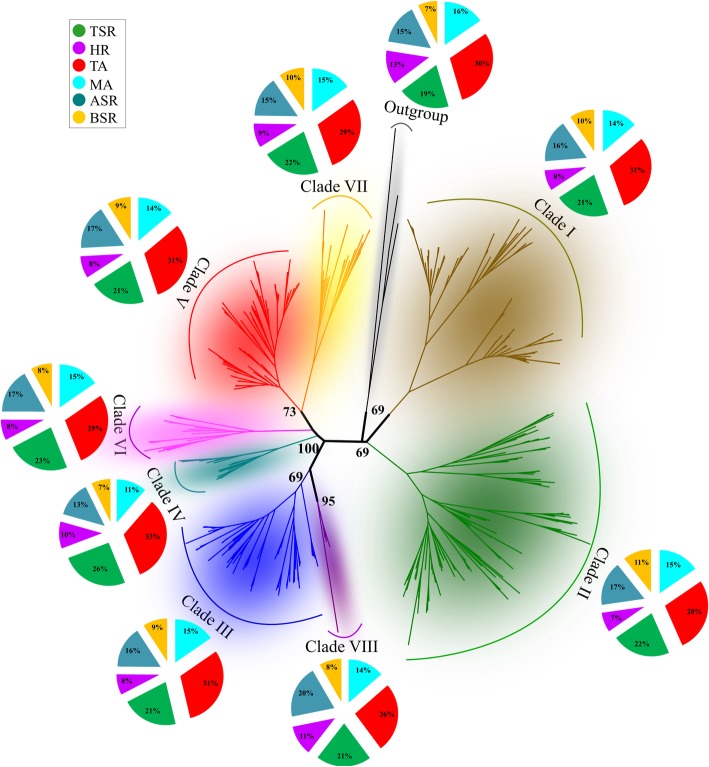
Fig. 2.
Correlation between the functional classification of CREs identified in this work and MLO proteins inference reported by Iovieno et al. (2016). The scheme depicts a phylogenetic tree of 396 MLO proteins from 25 genomes, indicating the distribution (%) of CRE identified in the MLO-PPRs of major clades (I-VIII) and outgroup (algae MLOs). The eight phylogenetic clades are indicated with different colours. The classification of CREs was based on the molecular function and the biological processes of the genes containing them. The 316 different CREs were grouped into 6 different classes: in blue “metabolic activity” (MA), in red “transcription activity” (TA), in green “tissue specific activity” (TSA), in violet “hormonal response” (HR), in cyan “abiotic stress response” (ASR) and in orange “biotic stress response” (BSR)

