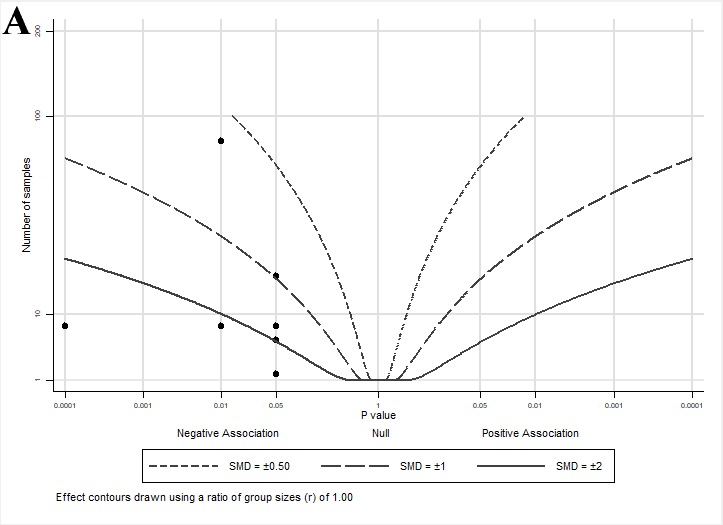
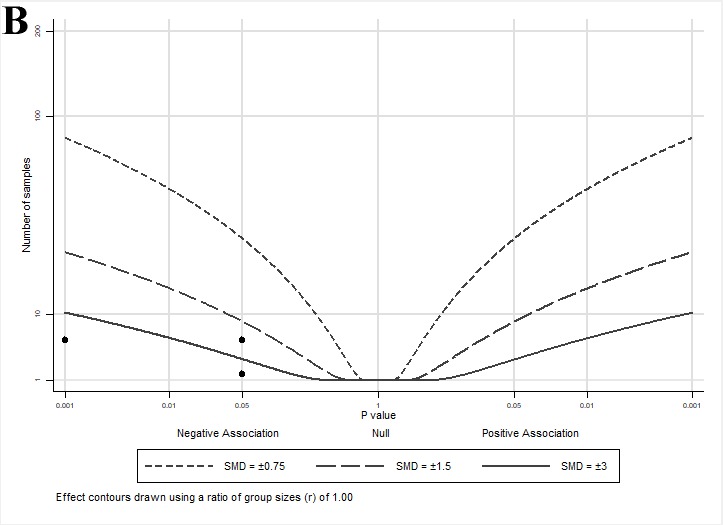
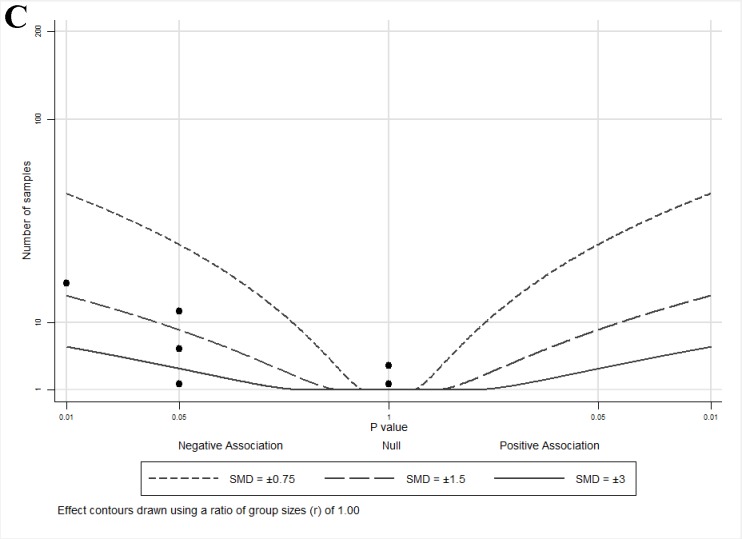
Figure 3.
Albatross plots for each outcome of cell culture studies: (A) indirect effects (growth); (B) indirect effects (other); and (C) direct effects. Each point represents a single study, with the effect estimate (represented as a p-value), plotted against the total given sample size (n) included within each study. Contour lines are standardized mean differences (SMD). p-values reported as <0.05 were plotted as 0.05 as a conservative estimate, while non-significant (null) p-values were plotted as 1.


