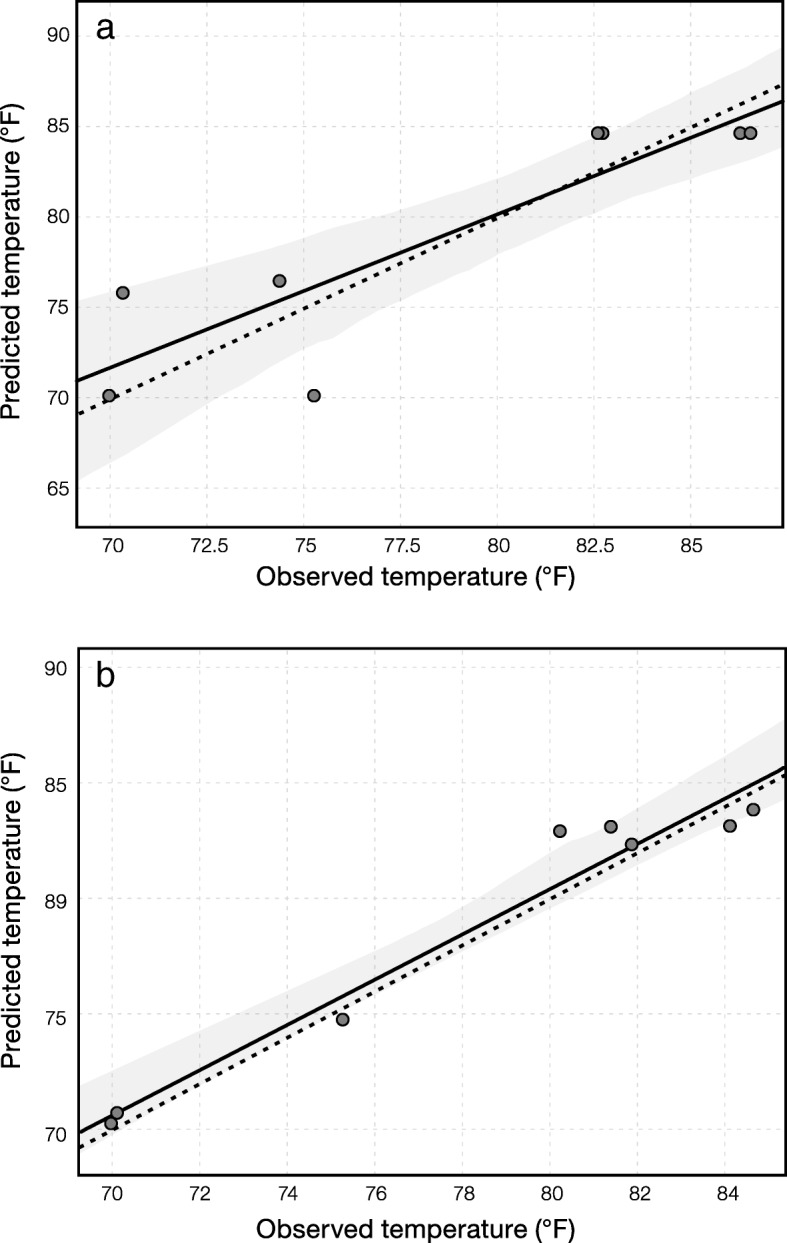
Fig. 2.

Prediction of temperature based on a the entire community and b the active community. The x- and y-axis denote observed and predicted temperature, respectively. The dashed line represents 1:1 ratio of observed and predicted value. The solid line represents the fitted trend of the observed and predicted value. The gray shadow represents 95% confidence interval with 100 times of estimation
