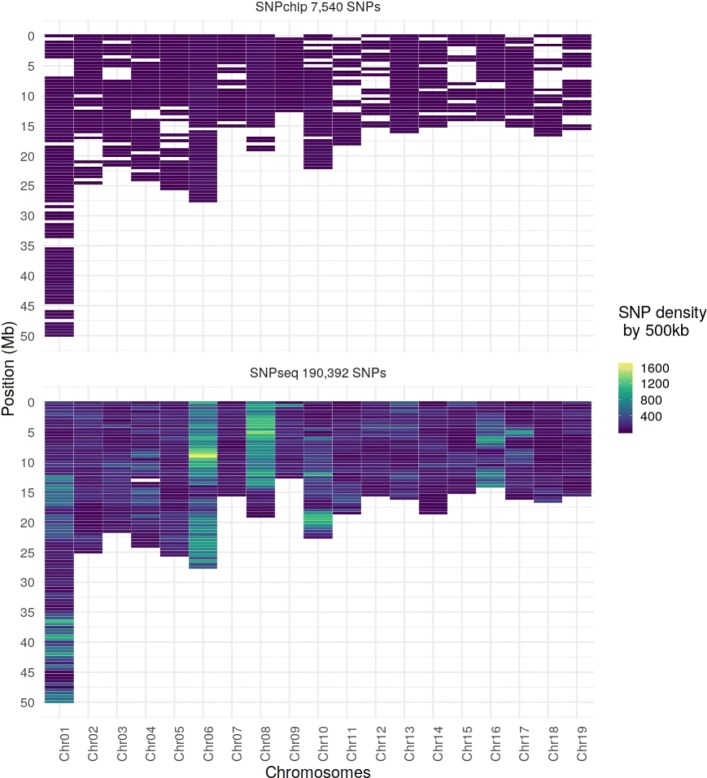
Fig. 5.
Comparaison of density marker before and after imputation. SNP density map before imputation (top panel), corresponding to the SNP chip genotyping, and after imputation from sequence (bottom) in 500 kb windows. SNPs were selected on two different criteria based on the percentage of alleles correctly imputed:Props (> 0.90) and cProps (> 0.80). The scale colour represents the density of markers, with dark blue for low density and yellow for high density

