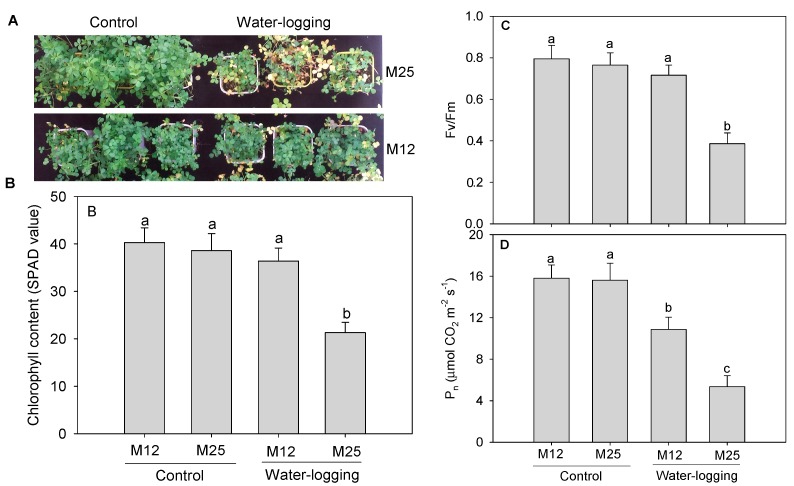
Figure 1.
Effect of waterlogging on the phenotypic trait (A), leaf chlorophyll content (B), maximum quantum yield of photosystem II efficiency (Fv/Fm, (C) and net photosynthetic rate (Pn) (D) in two alfalfa cultivars with contrasting waterlogging tolerance (M12: tolerant; M25, sensitive). Vertical bars on the top indicate standard deviation, and bars with the same letter indicate no significant difference at p < 0.05 for the comparison of different treatments (Duncan’s multiple range test).

