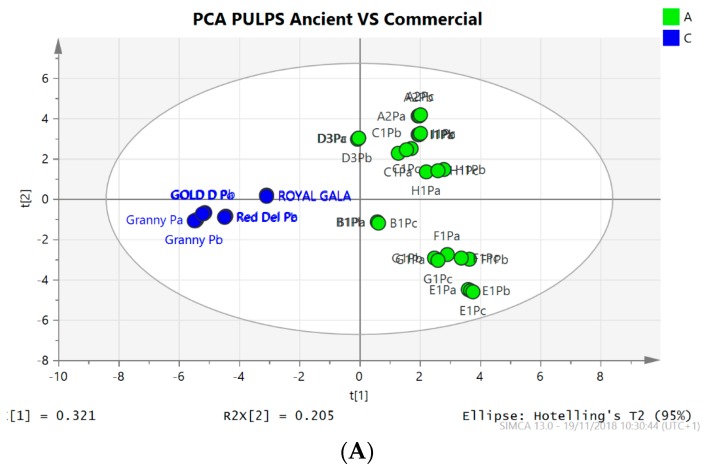
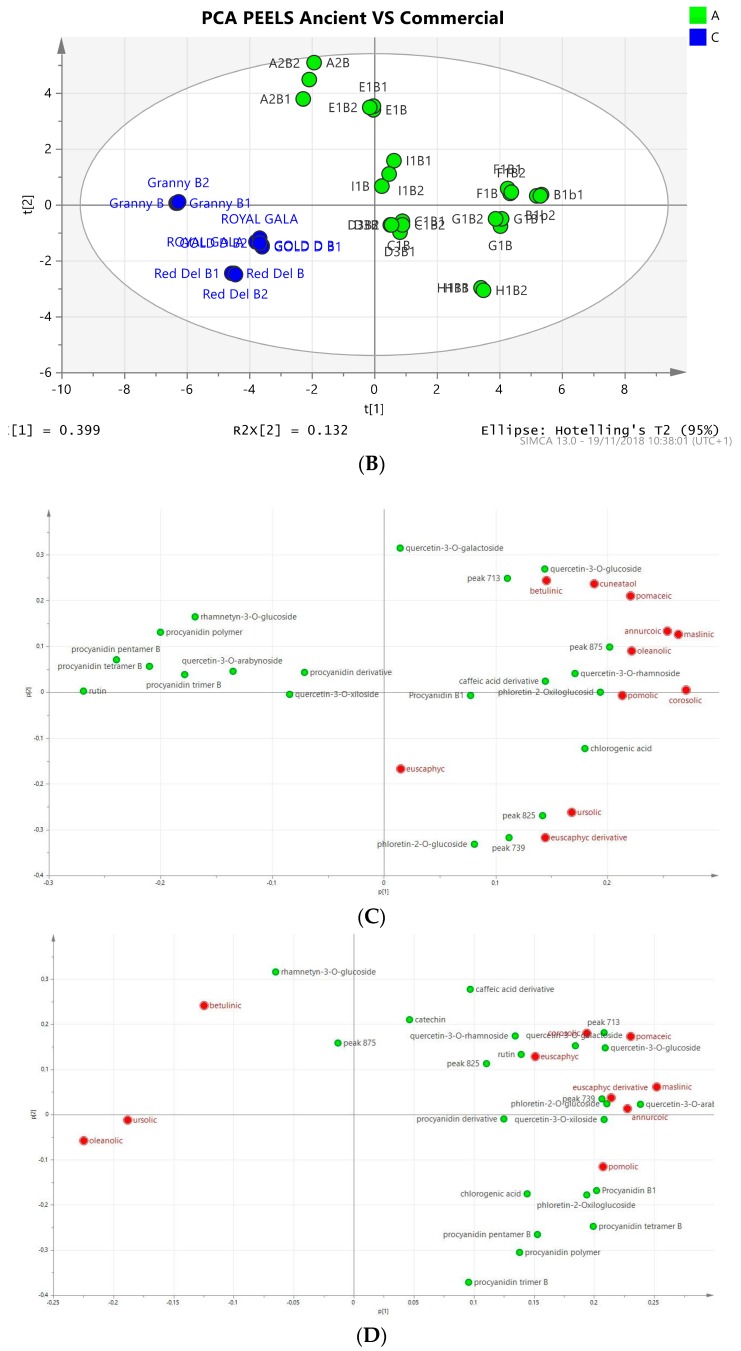
Figure 4.
Score scatter and loading plots of the PCA obtained from the LC-MS datasets for pulps (A,C) and peels (B,D) of the analyzed apple samples. Commercial (blue) and Ancient (green) samples are highlighted. An evident clustering was observed. Triterpene acids and phenolic compounds are highlighted in the plot with red and green color respectively.


