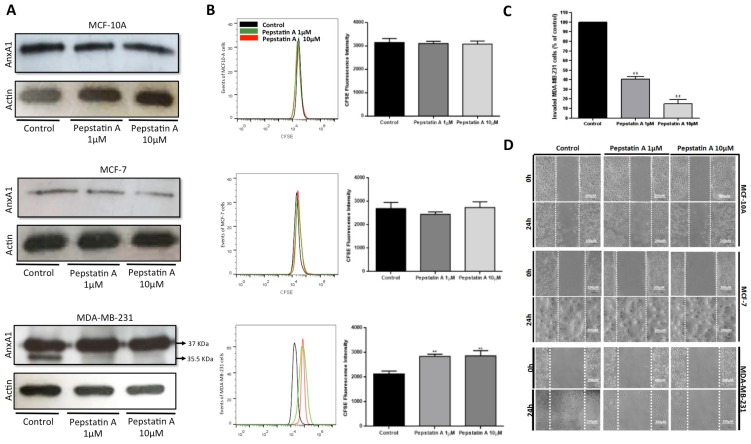
Figure 3.
CatD inhibition by PepA impairs proliferation, migration, and invasion of MDA-MB-231. (A) Western blot analysis of AnxA1 expression of cells treated or not treated (control, vehicle only) for 24 h with 1 µM and 10 µM of PepA. Full-length AnxA1 (37 KDa) was detected in all cells and cleaved form (35.5 KDa) was detected only in MDA-MB-231 cells. Actin was used as loading control. (B) Proliferation analysis of MCF-10A, MCF-7, and MDA-MB-231 cells treated with PepA (1 µM, grey peak; and 10 µM, red peak) compared to control group (vehicle only, black peak) using CFSE staining. Respective bar graphs show the CFSE fluorescence intensity and statistical analysis of three independent experiments expressed as means ± SD (**, p < 0.01). (C) Percentage of invaded cells relative to control was measured by Matrigel invasion assay. Graph shows the percentage of invasion of three cell lines and statistical analysis of three independent experiments were expressed as means ± SD (**, p < 0.01). (D) Migration potential was assessed by wound-healing assay. Cells were plated, scratched with pipette tips, and photographed by phase-contrast microscopy. Representative images, showing cells migrated at 0 h and after 24 h. Scale bars = 200 µm.

