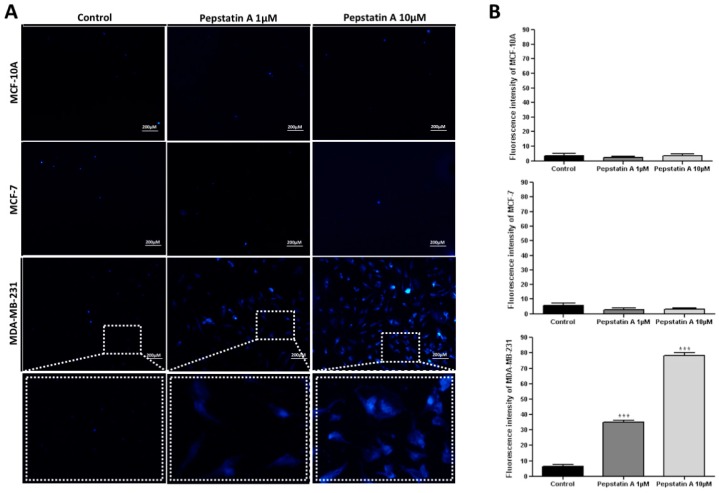
Figure 5.
CatD inhibition promotes MDC-labeled autophagic vacuoles formation only in MDA-MB-231 cells. (A) Autophagic vacuoles (blue) in MCF-10A, MCF-7, and MDA-MB-231 cells stained with MDC after exposure to PepA (1 µM and 10 µM) for 24 h compared to control group (vehicle only). Dashed rectangle demonstrates the zoom view of each cell group. Scale bars = 200 µm. (B) Histogram representing fluorescence intensity of MDC, determined by ImageJ software, in control and treated three cell lines. Data are expressed as the mean ± SD of three independent determinations, n = 15. Asterisks (*) indicate significant difference from control group (* p < 0.05; ** p < 0.01; *** p < 0.001). Comparisons between different groups were performed using one-way analysis of variance.

