
Fig. 3.
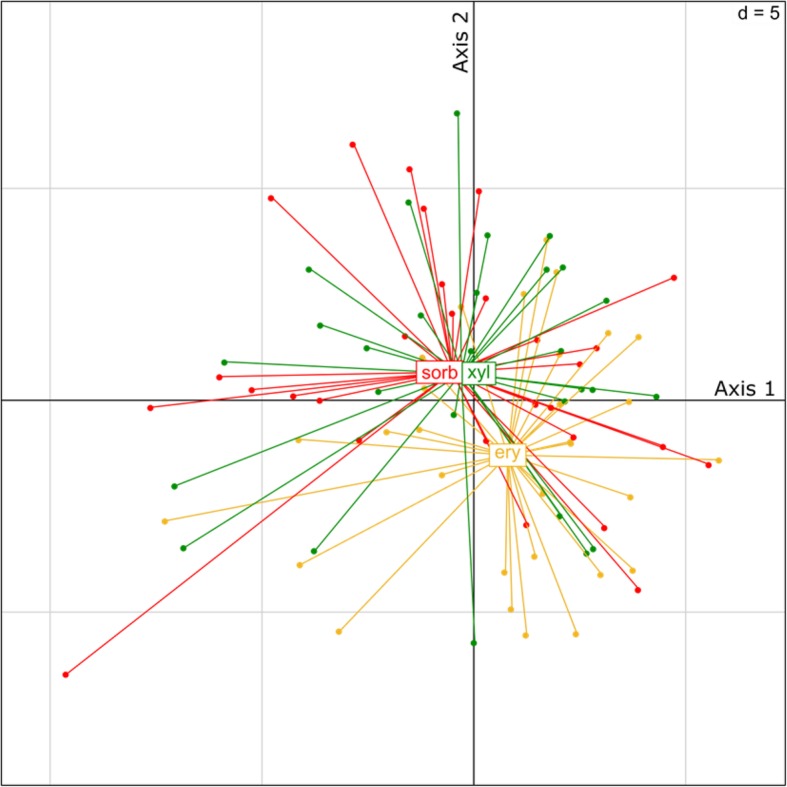
Plot of principal component analysis based on Hellinger transformed OTU relative abundance values. Individual saliva microbiome samples are connected to treatment centroids. First and second principal axes describe 16.7 and 13.3% of overall variation, respectively. Abbreviations: ery - erythritol, sorb - sorbitol, xyl - xylitol