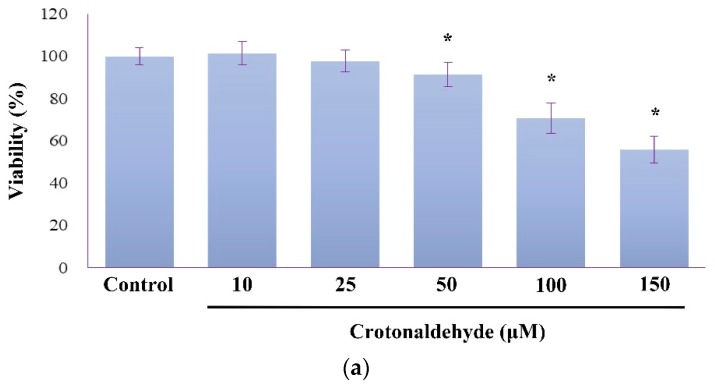
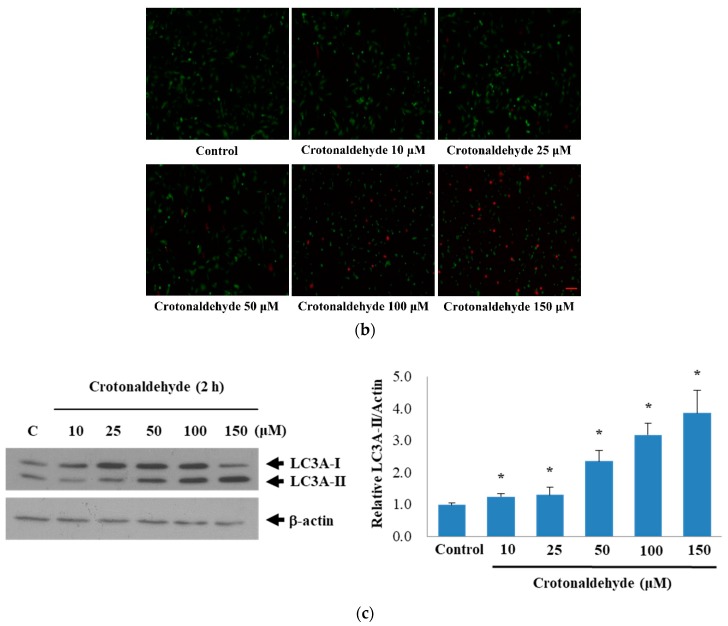
Figure 1.
Induction of cytotoxicity and autophagy by crotonaldehyde in endothelial cells (HUVECs). (a) MTT assay were used to determine viability of HUVECs exposed to different concentrations of crotonaldehyde (10, 25, 50, 100, or 150 μM) for 2 h. (b) Representative images showing cell viability in HUVECs exposed to different concentrations of crotonaldehyde for 2 h. Viability of cells was assayed using the Live/Dead assay kit, live cells exhibit green fluorescence and dead cells exhibit red fluorescence. Scale bars: 100 μm. (c) Western blot showing LC3A-II levels in HUVECs exposed to different concentrations of crotonaldehyde for 2 h. The results shown are representative of three independent experiments. Relative densitometric analysis of LC3A-II/Actin expression is shown. Data are expressed as mean ± SD of three independent experiments. * p < 0.05 as compared with the control group.


