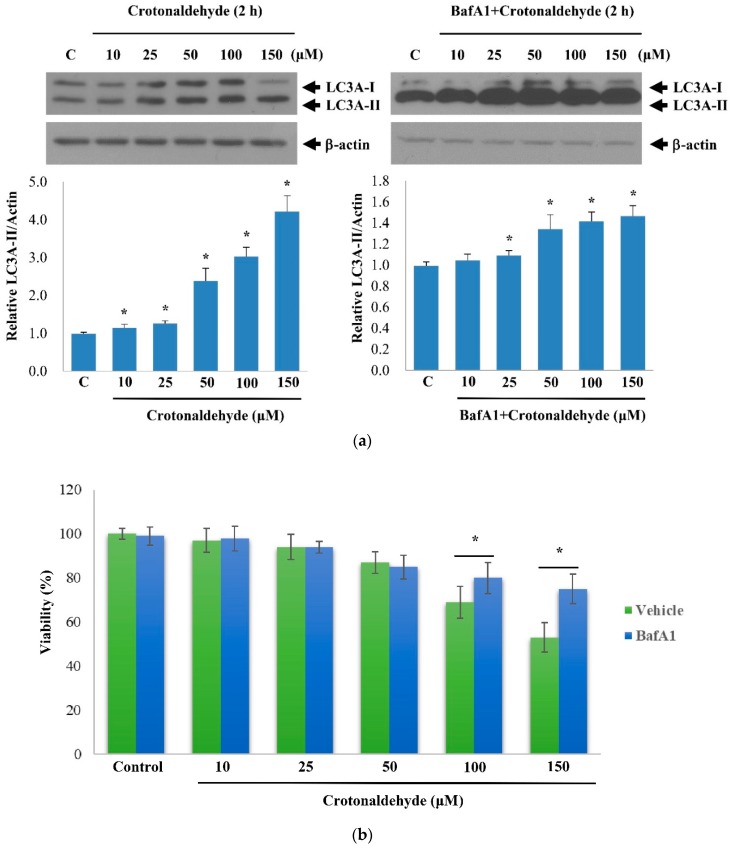
Figure 2.
Effect of crotonaldehyde on autophagic flux. (a) Western blot showing LC3A-II levels in HUVECs exposed to different concentrations of crotonaldehyde with or without pretreatment of 100 nM bafilomycin A1 (BafA1) for 1 h. Relative densitometric analysis of LC3A-II/Actin expression is shown. Data are expressed as mean ± SD of three independent experiments. * p < 0.05 as compared with the control group. (b) MTT assays were used to determine viability of HUVECs exposed to different concentrations of crotonaldehyde with or without pretreatment of bafilomycin A1 (BafA1). Data are expressed as mean ± SD of three independent experiments. * p < 0.05 as compared with groups treated with corresponding concentrations, without pretreatment of bafilomycin A1.

