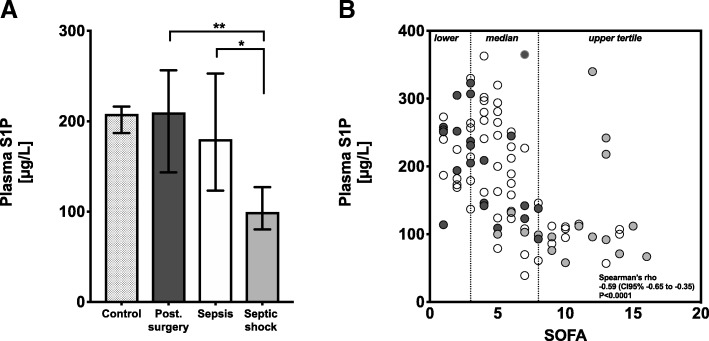
Fig. 1.
Plasma sphingosine 1-phosphate (S1P) concentrations in patient groups (a) and correlation with SOFA score (b). a Plasma S1P levels are presented as median with interquartile range, and patient groups were compared using a non-parametric ANOVA Kruskal-Wallis test between groups. Plasma S1P levels are lowest in patients with septic shock. *P < 0.05; **P < 0.01. b Plasma S1P levels are plotted together with the SOFA score. Surgical trauma patients: dark gray; sepsis patients: white; and septic shock patients: light gray dots. Vertical dotted lines indicate SOFA tertiles: lower SOFA ≤ 3, median SOFA 4–7, and upper SOFA ≥ 8 tertile. The statistic represents Spearman’s rank correlation for plasma S1P levels and the SOFA score with rho and 95% confidence interval

